Zilliqa is hoping to get partnered with tech giants, banks and moreover with Temasek, which is Singapore’s sovereign wealth fund who declared around $300 billion assets.
Zilliqa Price Analysis:

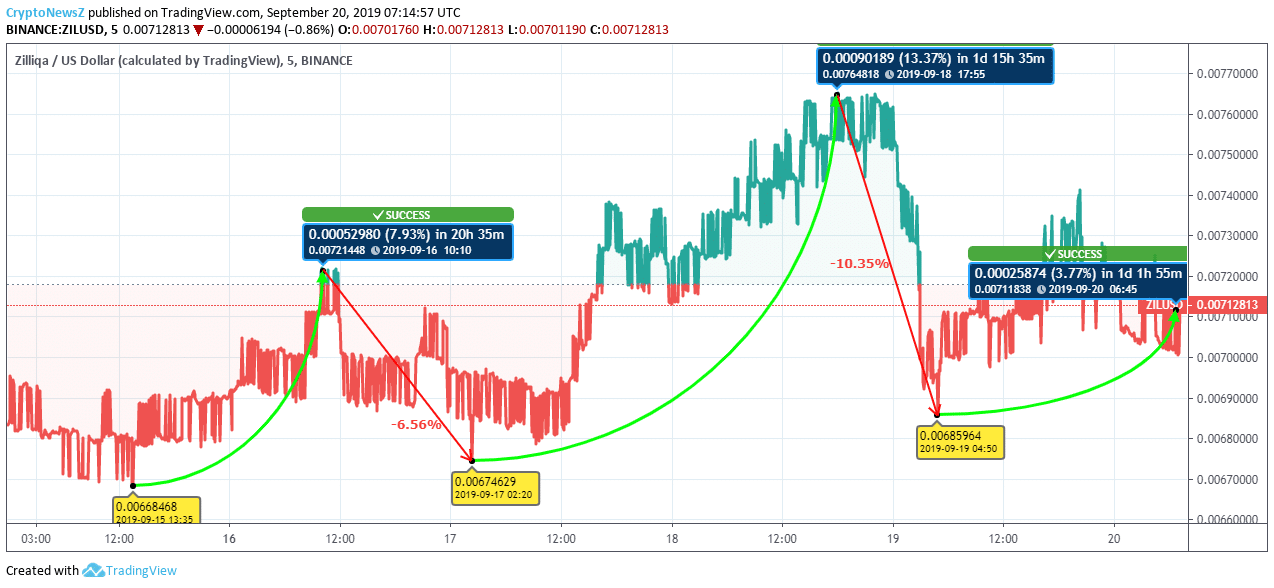
Analyzing the price trends from the past 5 days, the initial trading figure was realized below the baseline at $0.006684 as on September 15, at 13:35 UTC. The price of Zilliqa then escalated by 7.93% on September 16 at 10:10 UTC trading at $0.00721. The value saw a slight drop of 6.56% on September 17, at 02:20 UTC.
The value then saw an escalation of 13.37% to the highest touch point of $0.00764 on September 18, at 17:55 UTC. Yesterday, the price of Zilliqa fell by 10.35% when the trading value changed to $0.00685 at 04:50 UTC. The value from then is increased by 3.77% as of now.
ZIL value is trading in the bearish zone as of now. So the followers might want to buy the ZIL currency to enjoy the returns in the near future. However, let’s understand the trade in short-term and long-term movement.
Short-Term Movement:

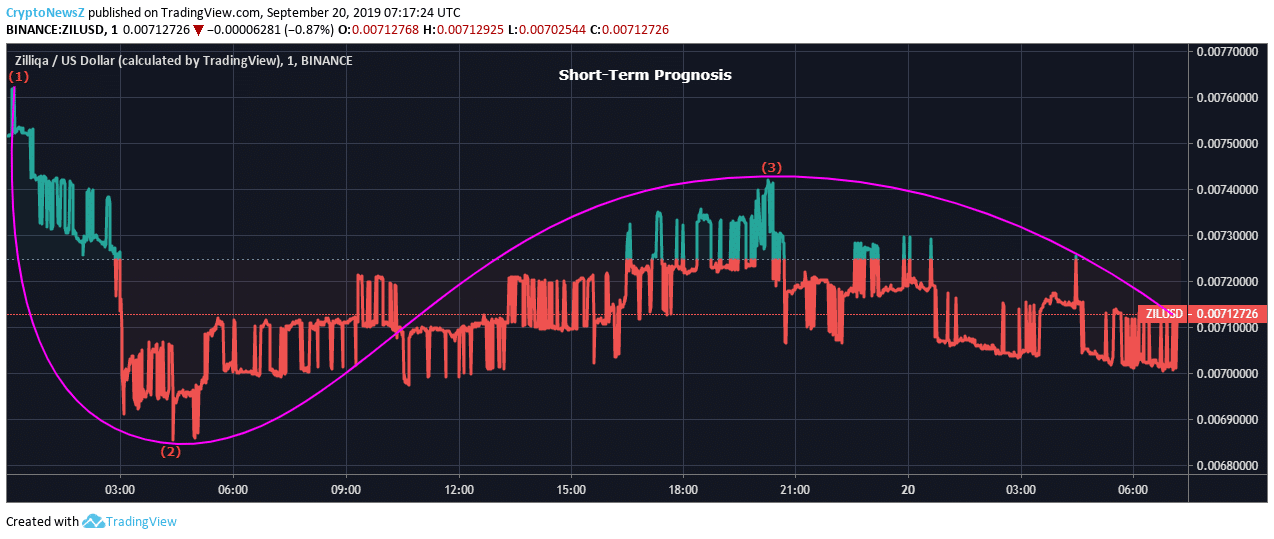
Considering the short-term movement, it seems that the price of Zilliqa might drop to the next lowest point where users can buy the coin and slide in the surging position to earn returns.
Long-Term Movement:

Advertisement
Long-term movement i.e. year to date movement seems to be under the bearish zone. New users can join the network of ZIL with their investments as Zilliqa Predictions by experts are going in good favor.
The calculated resistance and support levels are as follows:
Resistance Levels:
R1: $0.007547, R2: $0.007847, R3: $0.008122
Support Levels:
Advertisement
S1: $0.006972, S2: $0.006697, S3: $0.006397


