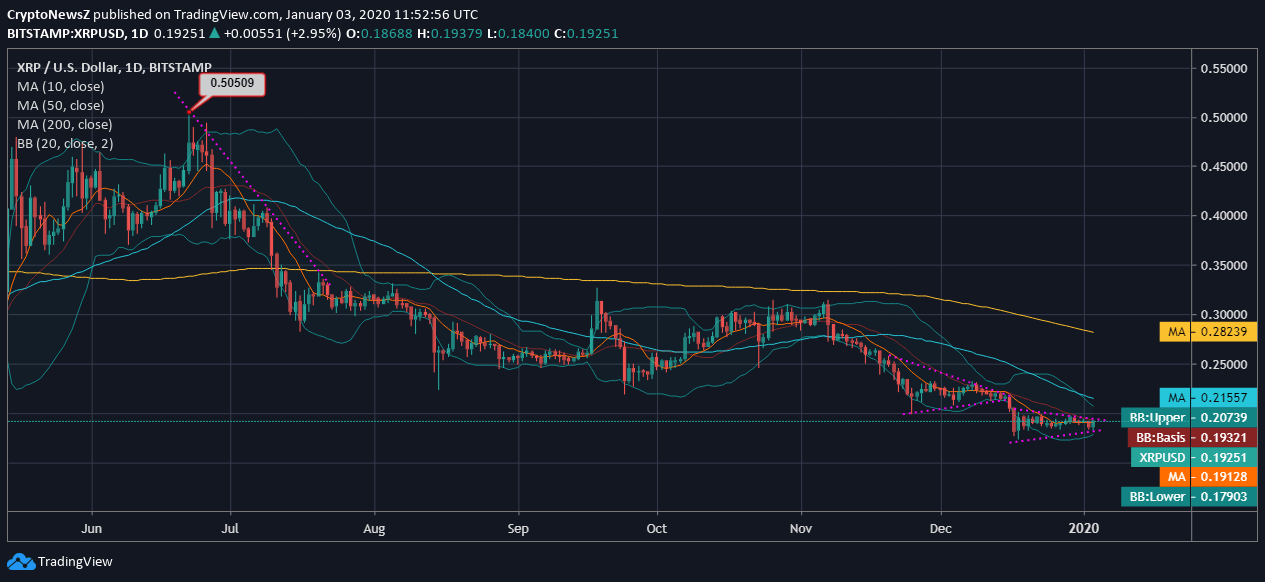
Ripple (XRP), at the time of writing, was trading at $0.192, after having corrected from $0.18 in the past 24 hours. The major support for the coin is lying at $0.18, followed by $0.17 and as per the current momentum, it seems that the coin will decline even further before it rises. Moreover, the coin has been on a continual decline after it soared as high as $0.505 in the previous year. Also, it was just in the previous month when Ripple to USD price had hit a 52-week low.
Analyzing the daily XRP/USD movement on Bitstamp, we see that the coin is giving gradual lower highs as it is formed an apex in the previous trading month. As per the current trend and momentum, we do not foresee an uptrend any soon as the coin lacks support as well. The 50-day and 200-day moving averages are out of the laid 20-day Bollinger Band width. The price is even lower than the Bollinger Band Basis, and the bands are seen tightening. However, there is slight support from the 10-day MA but the selling pressure remains dense and intact.
The technical indicators laid confirm the moderate bearishness due to intraday volatility faced by Ripple coin. The MACD of the coin is running below zero and holds a bearish crossover as the signal line overrides the MACD line.
The RSI of XRP is at 41.84 and is seen inclined towards the oversold region but holds no extremities at present. Therefore, read more about Ripple price prediction by our experts to know more about the possible future prices of XRP.


