

Focusing on XRP‘s daily chart, the token’s value has recently recovered from a low of approximately $0.4861, a level touched on Friday, October 25. As observed on TradingView, this level acted as a support zone where buying appetite began to push the price upwards after a period of decline.
Consequently, the rally has lifted the cryptocurrency to around $0.5159, suggesting renewed bullish interest. The key question now is whether the XRP token can maintain this upward trajectory and break through the resistance level around $0.53, which appears as a recent upper boundary in the trading range.
XRP’s On-Chain Data Fuels Optimism
XRP’s bullish outlook finds further validation in recent on-chain metrics, with open interest rising by 1.63% to $693.02 million. CoinGlass data shows this growth trend is coupled with a steady increase in the weighted funding rate since October 5, peaking at 0.0132% on October 24 and currently holding at 0.0101%.
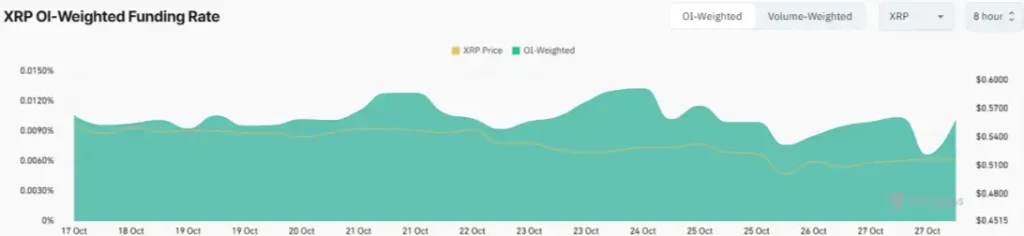
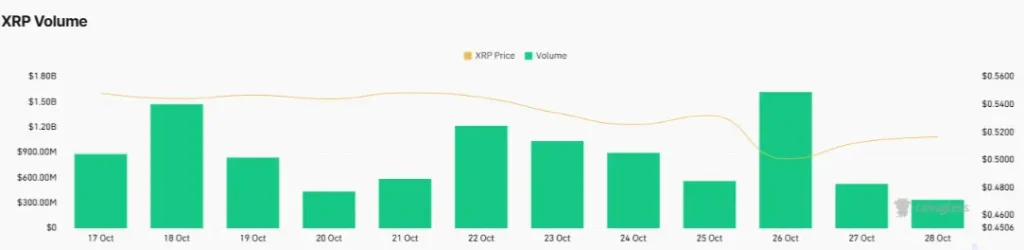
This uptick reveals strong confidence from long-position holders willing to pay premiums to maintain positions as they anticipate future gains. However, not all indicators are perfectly aligned with this bullish narrative. The token’s trading volume has dipped by 20.36% to $346.30 million, casting a slight shadow over the otherwise optimistic sentiment.
Advertisement
Liquidation data presents an additional complexity, with $6.67 million in long positions closed over the weekend against a relatively minimal $133.26K in short liquidations. This points to a lingering bearish undertone in the short term, with the cryptocurrency’s price action yet to overcome this tentative market caution.
XRP’s Technical Data Point to Consolidation
The RSI index moves sideways, with the RSI line positioned at 39.42. This indicates the XRP token is currently in a period of consolidation, with the potential for further price stability soon. However, a break above the neutral 50 level could cement a shift toward bullish momentum in the market, possibly pushing above key levels.
The MACD indicator also shows signs of potential consolidation as its MACD and signal line move horizontally close, suggesting a period of indecision among traders. This stalemate could lead to a continuation of the current sideways movement until a clear trend emerges.
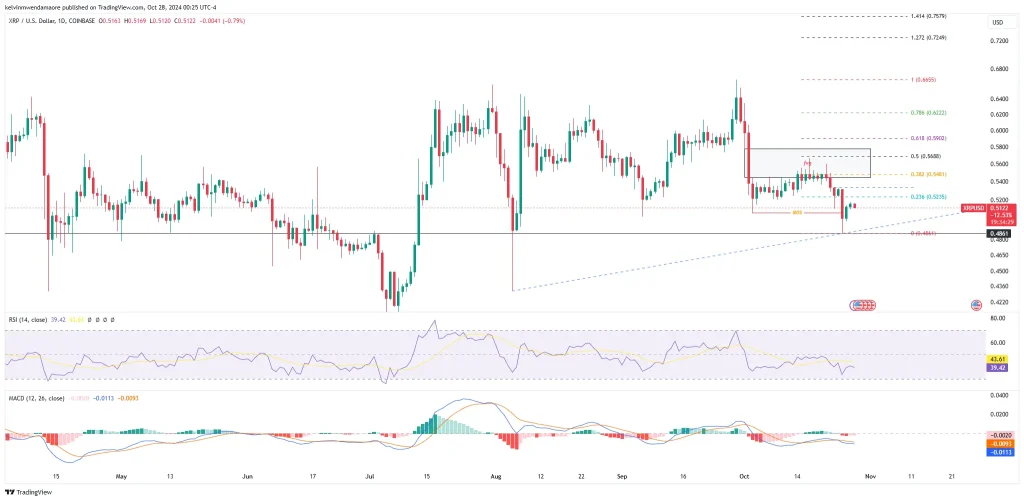
Such a scenario could result in the XRP cryptocurrency trading within a range-bound pattern in the short term. Yet, a push above the 23.6% Fibonacci level at $0.5235 would strengthen the bulls’ case, potentially setting the XRP token up to challenge the $0.53 resistance by week’s end.
A triumphant breakthrough here would solidify the bullish outlook, targeting $0.5688, aligning with the 50% Fibonacci level to fill the value gap from recent retracements. Yet, if resistance at $0.53 holds firm, we might see a pullback to $0.50—or even $0.48—before another bullish attempt unfolds.
Advertisement
Also Read: BTC Bulls Charge Towards $70K; Is a New All-Time High Imminent?


