This content has been archived. It may no longer be relevant.
XRP Price Movement Overview
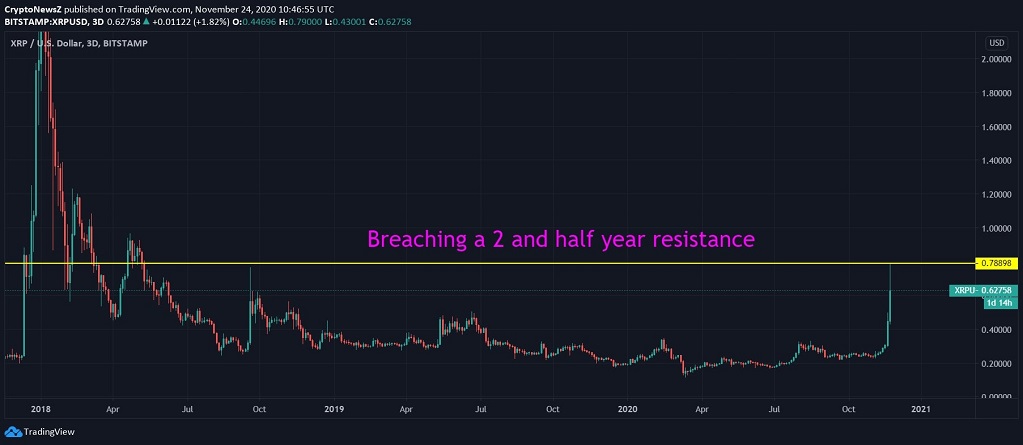
XRP has all the attention today as it regains its long-lost position against Tether—the stable coin ranked amongst the top 5 cryptos of the global market. Additionally, XRP price is currently reflecting a massive breakthrough today where it is up by approximately 81% from yesterday’s low of $0.429 to two and a half-year high marked at $0.788 just around the press time.

XRP Regains its Lost Position Amongst the Top 3
Moreover, XRP’s movement against the US Dollar has been a clear demarcation of its potential as the third-largest altcoin by market capitalization. The intraday price movement of XRP has lured a significant investor group today, and nonetheless, Ethereum is on the same spree breaching the same 30-month high in the global crypto market.
HOLY COW! #xrp up another 65% today! INSANE! #altcoins are about to have ungodly pumps! Big caps are just the start. Get ready!
— Lark Davis (@TheCryptoLark) November 24, 2020
Advertisement
XRP holds enough potential, and given the right set of investor groups and community, the coin can breach major resistances and trade above $1 if it continues the same momentum. However, the market forces need to create a real-time demand for this crypto. But we cannot ignore the fact that it the most volatile crypto amongst the top 3 and leaves behind Bitcoin as well when it comes to measuring the volatility. This is when XRP has exhibited two extreme price points just around the time of writing viz., $0.56 and $0.788.
The price action of XRP was not appealing for over two years and in less than two days, and this reflects how capable is the 2nd largest altcoin.
It took $XRP 4 days to erase 2 years of negative price action
Welcome to crypto lol
— Birch (@BitcoinBirch) November 24, 2020
XRP Price Analysis
Advertisement
On the intraday chart, XRP was seen drawing a pullback just around the time of writing, wherein it dropped from $0.788 to a daily low of $0.560 while corrected slightly upwards at $0.60. Click here to know the last week’s price movement of XRP/USD. Over the past three days, the price trend has been simple yet strengthening. Although the MACD chart shows a bearish divergence as the price of XRP collapsed by over 25%, the RSI of the coin is also holding a strong inclination towards the oversold region of 38.62. You can check XRP Forecast by our expert at forecast section to know more about the future price & market position of XRP.


