This content has been archived. It may no longer be relevant.
XRP’s breakout is a clear symbol of spurring investors’ hopes against the consolidating momentum that it bore for 30 months now before it breached above $0.75 in the last week. With a gain in momentum over the past week, XRP also regained its lost position that it failed to Tether in the previous quarter.
However, after an evident bullish steep rise at the onset of the previous week, the major cryptocurrencies, including Bitcoin and XRP, pulled back to weekly lows at $16.2k and $0.455, respectively. But the current price action is drawing a daily bullish crossover against the lows hit, as XRP trades a cent above $0.60 at $0.61.
#XRP is pumping! Spread the news.
— CryptoBull (@CryptoBull2020) November 30, 2020
Advertisement
XRP price pump is real regarding the price movement of Bitcoin, which is also seen spiking and regaining its lost position. XRP/USD also experienced an amplification in the market cap, which led to edging above the stable coin—Tether. It was just yesterday when XRP breached the downtrend and broke out on the hourly chart to reclaim the bullish move against the greenback.
Zooming in on the 1-Hour chart I found a very interesting scenario. #XRP has already broken out of its symmetrical triangle and is forming and Inverse Head & Shoulder pattern (bullish). This will be a great 🚀Sunday🚀. pic.twitter.com/KEV7ldDb37
— CryptoBull (@CryptoBull2020) November 29, 2020
The inverse Head and Shoulders created on the hourly chart yesterday reflects a precise bullish scenario in days to come. The current trading price above $0.60 is a clear demarcation of bullish divergence on the intraday chart.
Related: Check our Ripple Prediction
XRP Price Analysis

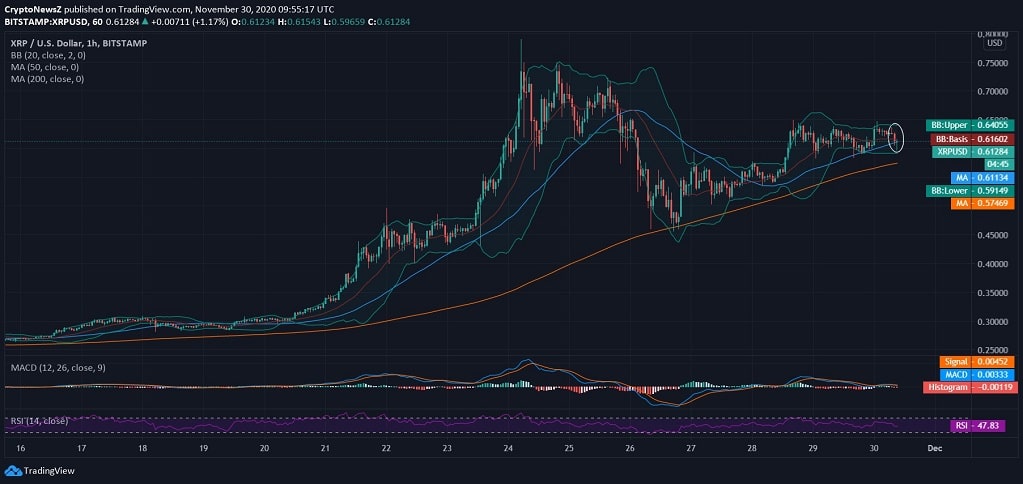
At the press time, XRP price was seen trading above $0.60, drawing an intraday bullish move against the USD despite a slight bearish crossover on the hourly chart due to rejection at $0.63 in the wee hours of the trading session today. It was until the recent rejection when XRP/USD was seen holding a strong inclination towards the upper BB.
Advertisement
With an intraday bearish candlewick, XRP price dropped as low as $0.60 and tested 50-day MA support on the hourly chart but with the current trading price of XRP at $0.61 leading to regain the lost support at $0.611. The RSI is lying at 47.83 with an inclination towards the oversold region after the price slash.


