CoinGlass data reveals that XRP’s funding rate has consistently stayed in positive territory, recently spiking to an all-time high of 0.0589%. This metric, closely watched for gauging market sentiment and leverage in futures markets, has sparked debate among traders: does it signal a bullish push or a possible setback for XRP’s price trajectory?
In this case, the high funding rate suggests strong demand for the XRP token in the near term, as long positions are willing to pay a premium to short holders to keep their trades open. This dynamic often indicates confidence in an ongoing bullish trend, hinting that further gains could be in sight. Yet, such elevated funding rates also raise the possibility of a pullback, as markets often correct to restore balance.
Following this funding rate spike, the cryptocurrency’s price peaked at $0.74, a level last seen in March. However, a slight pullback has lowered the cryptocurrency’s price to around $0.696, hinting at a possible pause or reversal as traders reassess the landscape. As analysts continue to assess these movements, many are closely monitoring the latest XRP Price Prediction to understand better whether this funding rate surge could lead to a sustained rally or a temporary top.
XRP Price Outlook: Bullish Structure, But Pullback Potential Persists
Advertisement
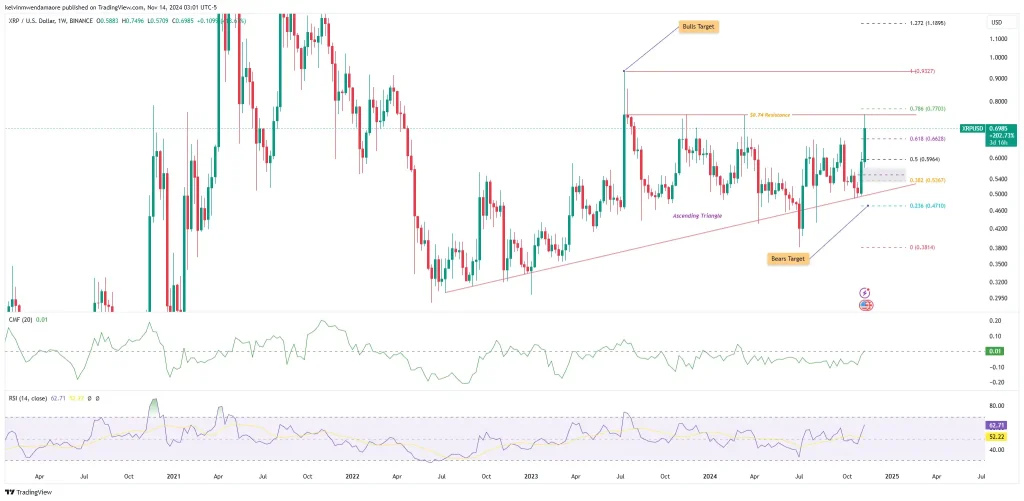
The weekly chart of the XRP token reveals a well-formed ascending triangle pattern, typically a bullish formation, suggesting that the market sentiment leans toward an upward breakout. This pattern aligns with the recent uptick in the cryptocurrency’s price, which recently touched the resistance at $0.74. The current price position within the pattern implies that a breakout above this level could pave the way for a continuation toward the “Bulls Target” around the 1.272 Fibonacci extension level at $1.18.
However, the token’s struggle to hold above $0.70 and the slight retracement around $0.696 could indicate a temporary pullback, possibly leading to a test of support levels near the 0.618 Fibonacci level at $0.6628 or even the lower boundary of the ascending triangle. If the price falls below this lower trendline, we might see a further decline toward the “Bears Target” around $0.4710, aligning with the 0.236 Fibonacci retracement.
Supporting indicators such as the Chaikin Money Flow (CMF) show minimal positive divergence (0.01), which suggests limited distribution. This metric hints that buying pressure remains strong, although caution is advised given the recent funding rate surge. Additionally, the Relative Strength Index (RSI) is hovering slightly above 50, currently at 62.71, signaling that the XRP token remains in bullish territory but is not yet overbought, leaving room for further upside movement.
Advertisement
Also Read: DOGE Hits All-Time High in Large Transactions, Surges 114% in a Week


