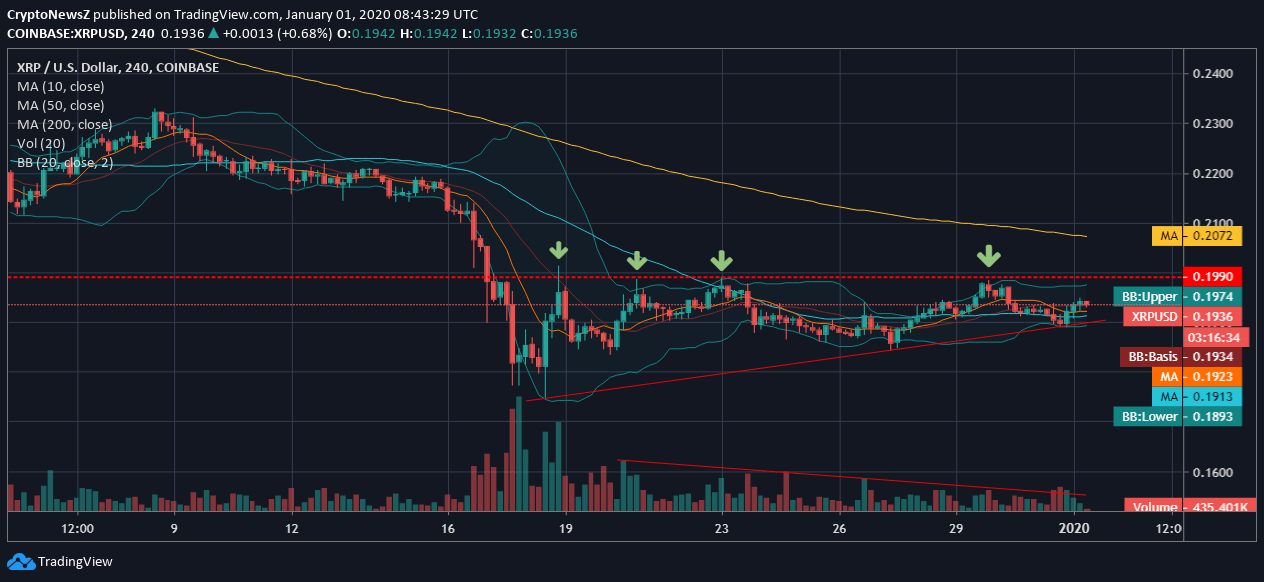
Ripple (XRP), at the press time, is trading at $0.193 and is supported by the short-term and medium-term MA. XRP against USD is trading better than the marked 52-week low at $0.1784. The price zone near $0.20 remains a goal at present as the price of Ripple is facing strict resistance as it pushes the price below $0.1990.
Ripple Price Analysis

Analyzing the 4-hourly movement of XRP to USD on Coinbase, we see that the coin has been on a downslide in the previous month. Important to note that after having faced a nosedive from $0.23, Ripple price is currently facing strict resistance at $0.1990. A breakout above the stated price zone can lead to a bullish crossover.
Advertisement
The volume laid on the same 4-hourly chart is also seen having a fall as the coin has an almost flat movement in the past 10-12 days. The current price is supported by the short-term and medium-term MA i.e., the 10-day and 50-day daily moving averages. Alongside, we also see a gradual uptrend forming. The short-term and the medium-term moving average is placed inside the 20-day Bollinger Band, but the 200-day MA is still a goal to be achieved.
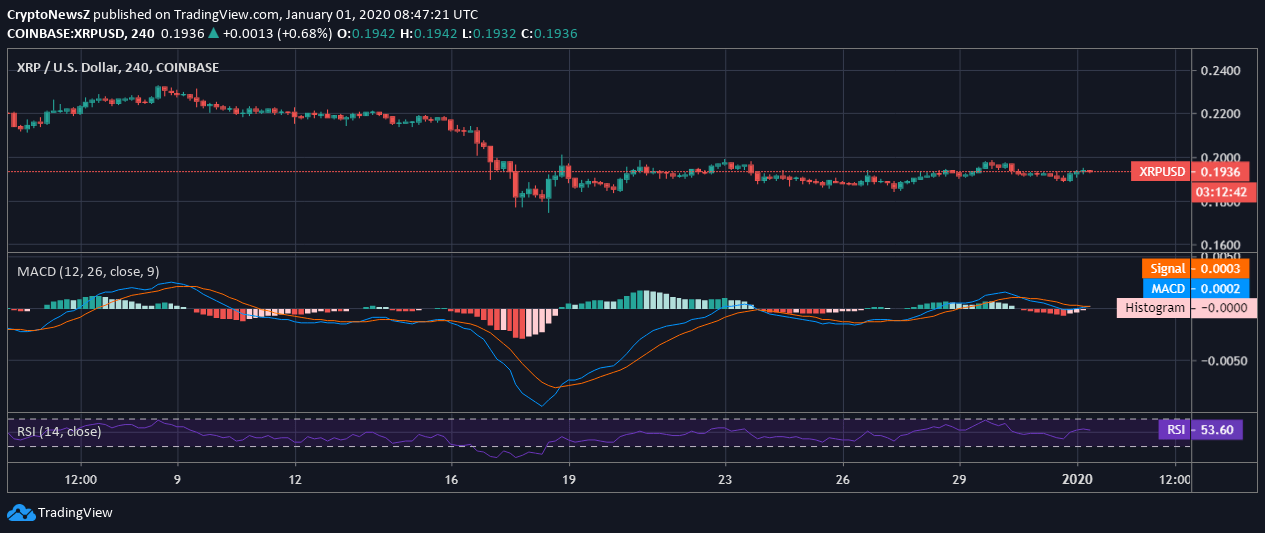
The technical indicators laid to show that the MACD of the coin is running above zero but holds a bearish crossover as the signal line overrides the MACD line.
Advertisement
The RSI of the coin is at 53.60 and remains less volatile, which is even confirmed by the 20-day Bollinger Band, wherein the Bands are seen squeezing.


