XRP, the native currency of Ripple, has hit a 5-month high as we see the crypto market gearing up and BTC trading above $11k. Bitcoin has breached an approximate year-long resistance as it trades above $11k after a notable 30-day consolidation below $10k, and it was just within two days that the coin soared above $11k in the last week of the previous month.
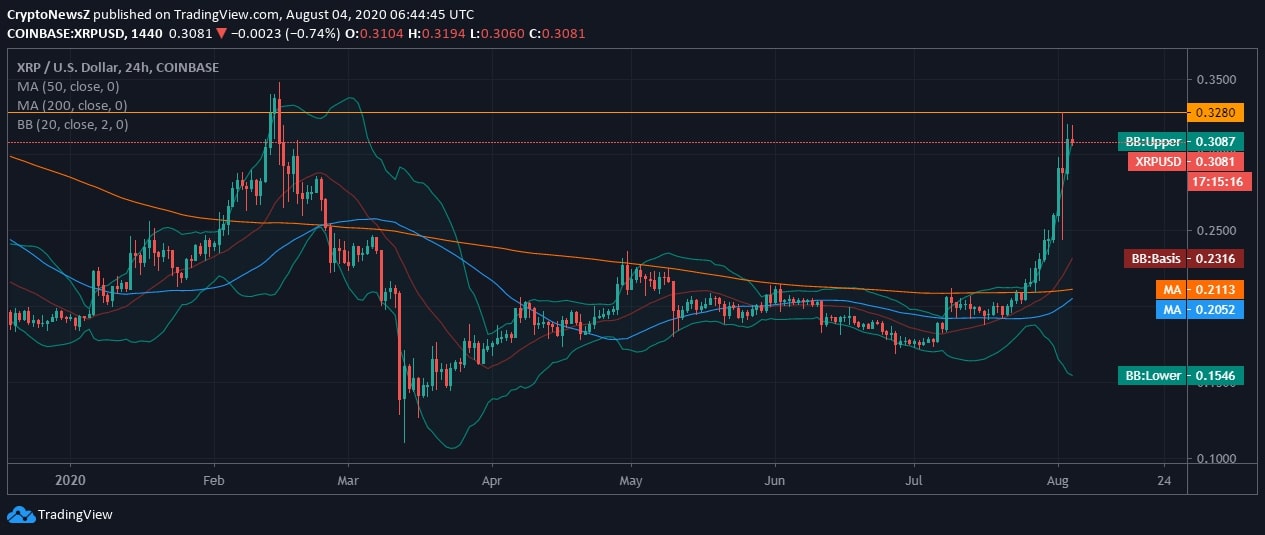
XRP ended the previous month trading around $0.25 with an approximate rise of over 45% in 30 days as it started the last trading month below $0.20 at $0.175. XRP, with a recent gain in trading price, spiked as high as $0.3280 in the past 24 hours.
Usually, a stock or security book profits for its investors and in the market when the company posts quarterly or yearly gains. Ripple recently published its Q2 reports of 2020 to extend clear and consistent updates on the company’s view about the XRP market. This report includes insights about quarterly updates and relevant XRP-related announcements.
Advertisement
In this report, Ripple gave a summary of direct institutional sales (OTC), which gave a clear comparison between quarter 1 and 2 sales figures. The OTC sales in quarter 1 were $1.75 million, which increased to approximately 18 folds in quarter 2, recording a figure of $32.55 million.
The Q2 2020 XRP Markets Report provides an in-depth analysis of the current #crypto markets, highlights a continued pause in programmatic #XRP sales and explores the latest crypto market moves. https://t.co/IYK8agJgCY
— Ripple (@Ripple) August 3, 2020
Moreover, financial institutions are now leveraging XRP as a mode of payment to have a quick, reliable option for sourcing liquidity on demand encouraging global payments and sustainability.
Financial institutions that want a fast, reliable option for sourcing liquidity on demand can do so with #ODL, which leverages #XRP—the best digital asset for global #payments and #sustainability. https://t.co/WXSTNaFadS
— Ripple (@Ripple) August 3, 2020
XRP Price Analysis

XRP, on the above 24-hour chart, is clearly breaching a 5-month resistance with the strong support of the daily MAs at $0.20 and $0.21. XRP/USD price trend is seen spiking since the last week of the previous month when it was trading around $0.20. the price trend of XRP is already breaching the upper 20-day Bollinger Band on the 24-hourly chart against the greenback.
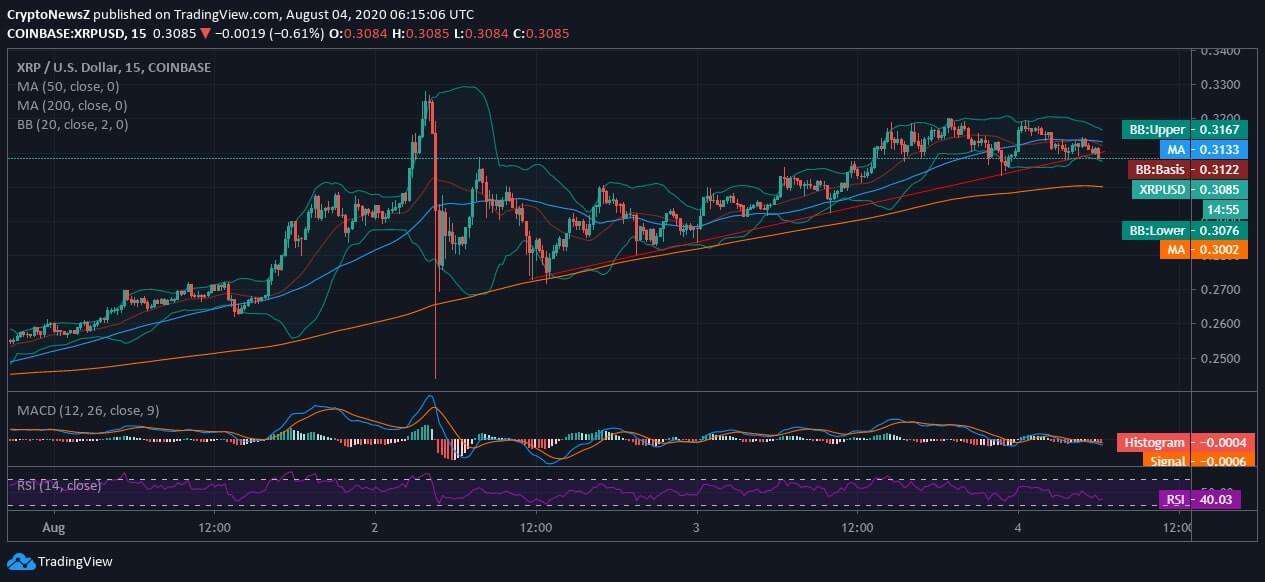
However, if we take an emphasized view of the XRP price movement, we see that the currency is drawing a clear uptrend on the intraday chart. Moreover, the recent spike above $0.320 has led to the strengthening of XRP coin after trading sideways. However, on the intraday chart, XRP is failing to retain 50-day MA support while holds 200-day MA support at $0.3002.
On the contrary, the 20-day Bollinger Bands are seen moderately squeezing, which project short-term breakout. This clearly brings us to the conclusion that the XRP is a volatile investment option with a short-term breakout possibility.
Advertisement
The other technicals laid are drawing a slight bearish crossover due to pullback from the intraday high at $0.3280 while the coin currently (at the press time) trades at $0.3085. In this regard, the signal line is trading above the MACD line, and the RSI is inclined towards the support area; however, it holds no extremities at 40.03. Although, You can always check the Ripple price today from our price page with the live price chart.


