This content has been archived. It may no longer be relevant.
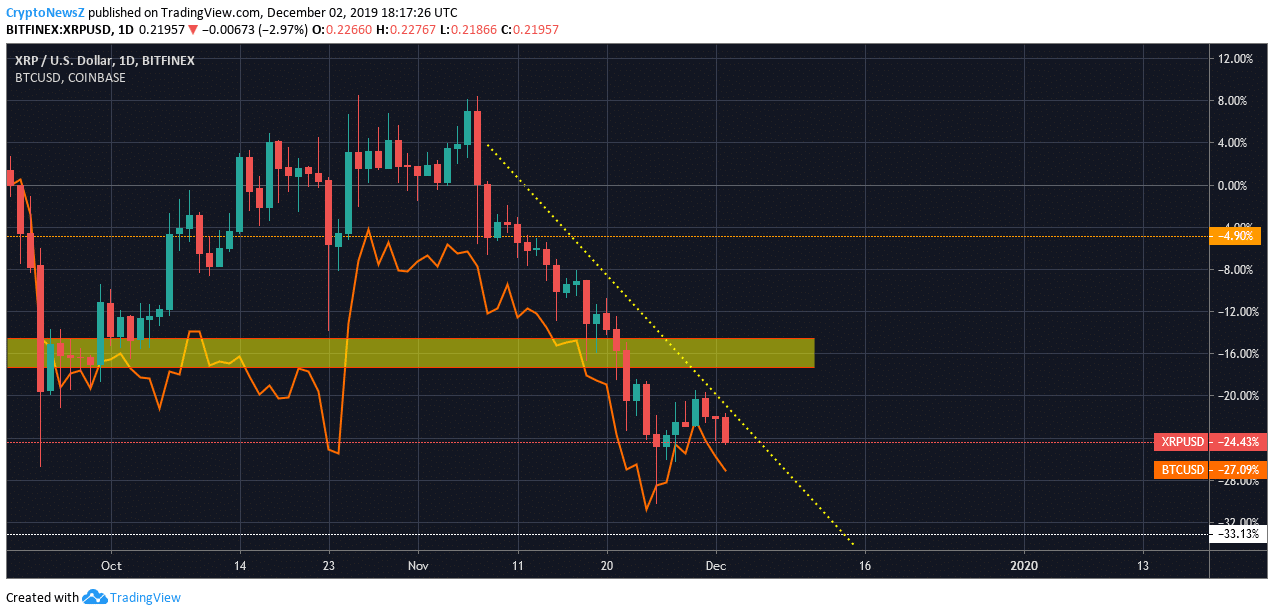
Ripple breaches weekly support and moving towards the critical support; Captain Bears have the Helm of this ship and turbulent times ahead. Meanwhile, the XRP price is closely following the BTC/USD prices.
*The orange line denotes Bitcoin price

Ripple Price Prediction
Advertisement
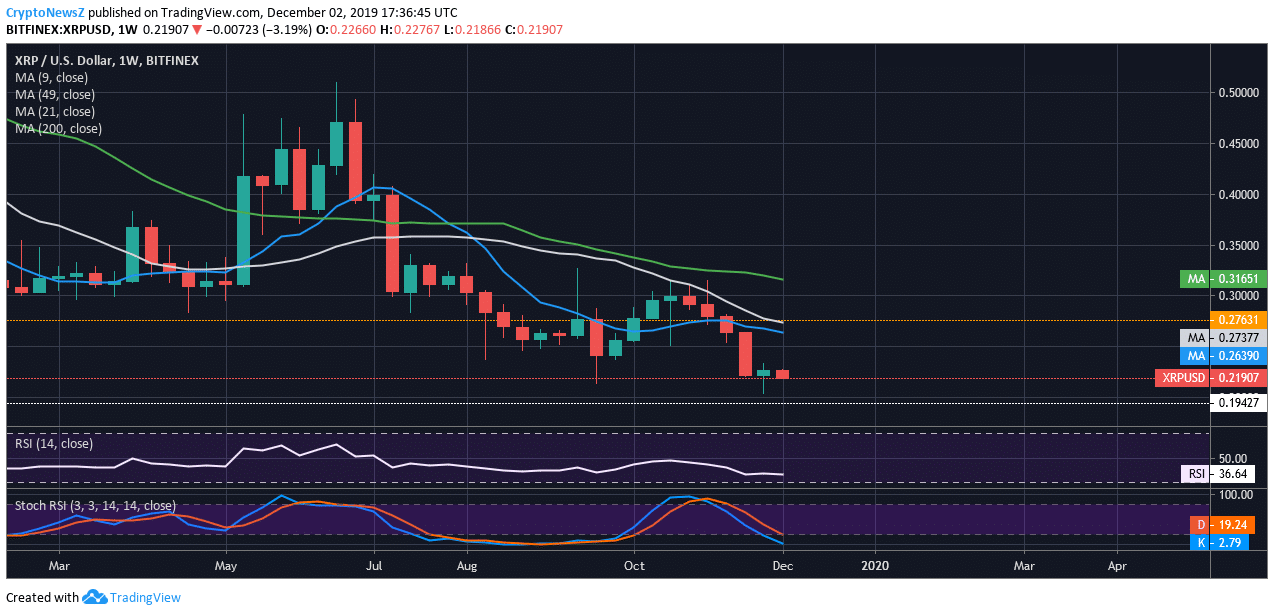
Weekly XRP to USD price has breached weekly key support at $0.27 represented by an orange dotted line and moving towards the critical support of $0.19 represented by a white dotted line. Ripple Price is below 9 days SMA (Simple Moving Average), 21 days SMA, and 49 days SMA indicating that the bears are in full control, and the prices may go down further to test weekly critical support.

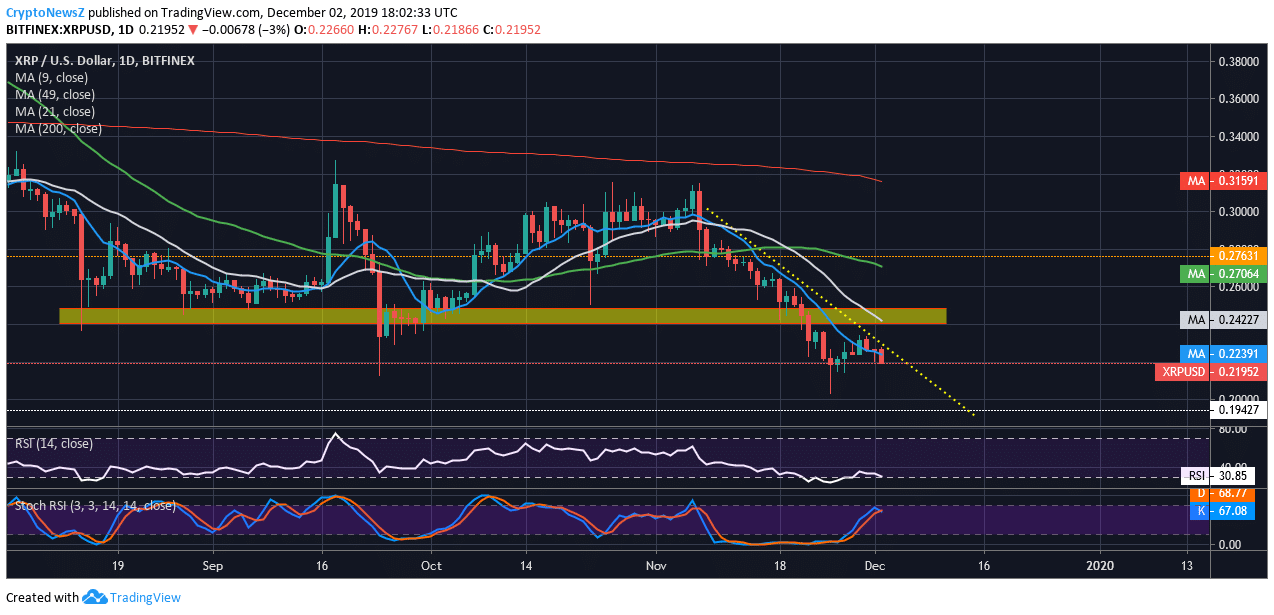
Daily prices are under 21 days SMA (white line) and 49 days SMA (green line), clearly indicating that this downtrend is strong. Currently, XRP coin is struggling to maintain its support around $0.22 to $0.24 at 9 days SMA. If it breaches 9 days SMA, prices may go down further. $0.24 level is the next daily resistance shown by the yellow shaded area in the below given XRP chart which also coincides with 21 days SMA (Simple Moving Average). RSI is 30.85 which is close to the oversold region. Meanwhile, Stoch RSI clearly shows that the Ripple price can go lower further as it is approaching the overbought region.

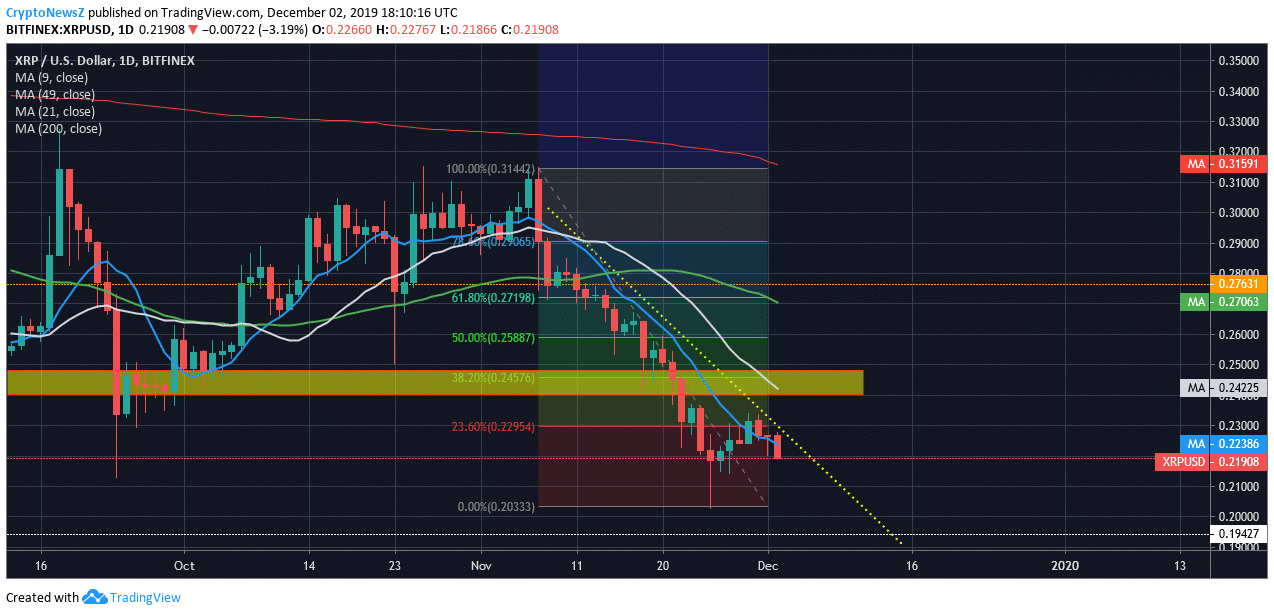
XRP daily prices got rejected by 23.6% Fib level at $0.23, as seen clearly in the below-given chart. Since it got rejected by the 23.6% Fib level, Ripple’s daily prices may be heading towards the weekly critical support at $0.19.

Advertisement
Conclusion: Overall trend is bearish, and the Ripple prices may go down further to test its weekly critical support of $0.194 made around Dec 2017, it would be wise to wait and long XRP once there is a clear reversal signal.


