This content has been archived. It may no longer be relevant.
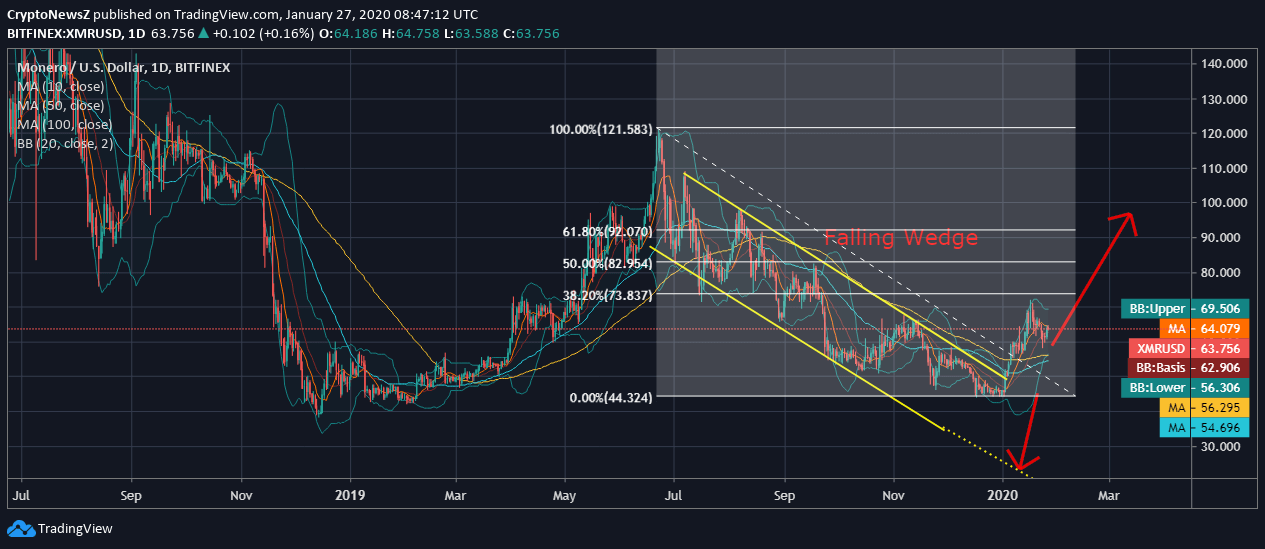
- Monero, at the time of writing, was trading at $63.75, having experienced a falling wedge breakout
- The current price of XMR is approaching the daily support at $56.29, i.e., 100-day Moving Average and is surrounded by daily 10-day Moving Average at $64.07
- Currently, trades slightly below $38.20% Fib Retracement Area, having faced strong resistance above the said level since October 2019
Monero (XMR), after experiencing a despairing latter half in the bygone year, attempted to gain pace as it hit a fresh 90-day high at $71. XMR coin gained comparatively better in this short-term hike that happened over the fortnight. This growth is aiding the coin to retain support from the daily moving averages as it faces volatility over time.
Monero Price Analysis

Taking a glance at the daily movement of XMR/USD on Bitfinex, we see that the coin has been on a continual rejection above $100 since the latter half of the previous year. The falling wedge formed has led the Monero coin to test support around $44. The current trading price is a result of a rebound from the said lowest as it trades at $63.75 with support from 10-day daily MA.
Advertisement
The 20-day Bollinger Bands laid do not project any major volatility in the recent future due to the right support retained. A break above 38.20% Fib Retracement Area is likely to pump in growth and near-term bullishness. However, as per Monero Predictions, we cannot simply expect a bullish breakthrough before anticipation of a fall within the wedge channel.
Technical Indicators
The other technical indicators applied to indicate the slight intraday dip that the price of Monero has faced due to which we see a ‘’death crossover’’ as the signal line overrides the MACD line.
Advertisement
The RSI of the coin is at 58.57, sliding downsides from the overbought region.


