Cardano is facing some difficulty in breaking the resistance zones and trading in a consolidated range has become frustrating for investors. Currently, ADA is sandwiched between Binance coin having a market cap of $57 billion and Dogecoin with a market cap of $42 billion.
At the current valuations of close to $1.5, what scenarios can push ADA to the top cryptocurrency spot? Well even at the value of $1.58 its market cap is close to $50 billion, and to become the top contender ADA just needs to cross $25. This raises the question of whether the upside of this cryptocurrency is limited.
Since Cardano cannot be mined and works on a proof of stake mechanism, there is some brighter potential in this cryptocurrency, but reaching the top spot may be bumpy.
Cardano Technical Analysis
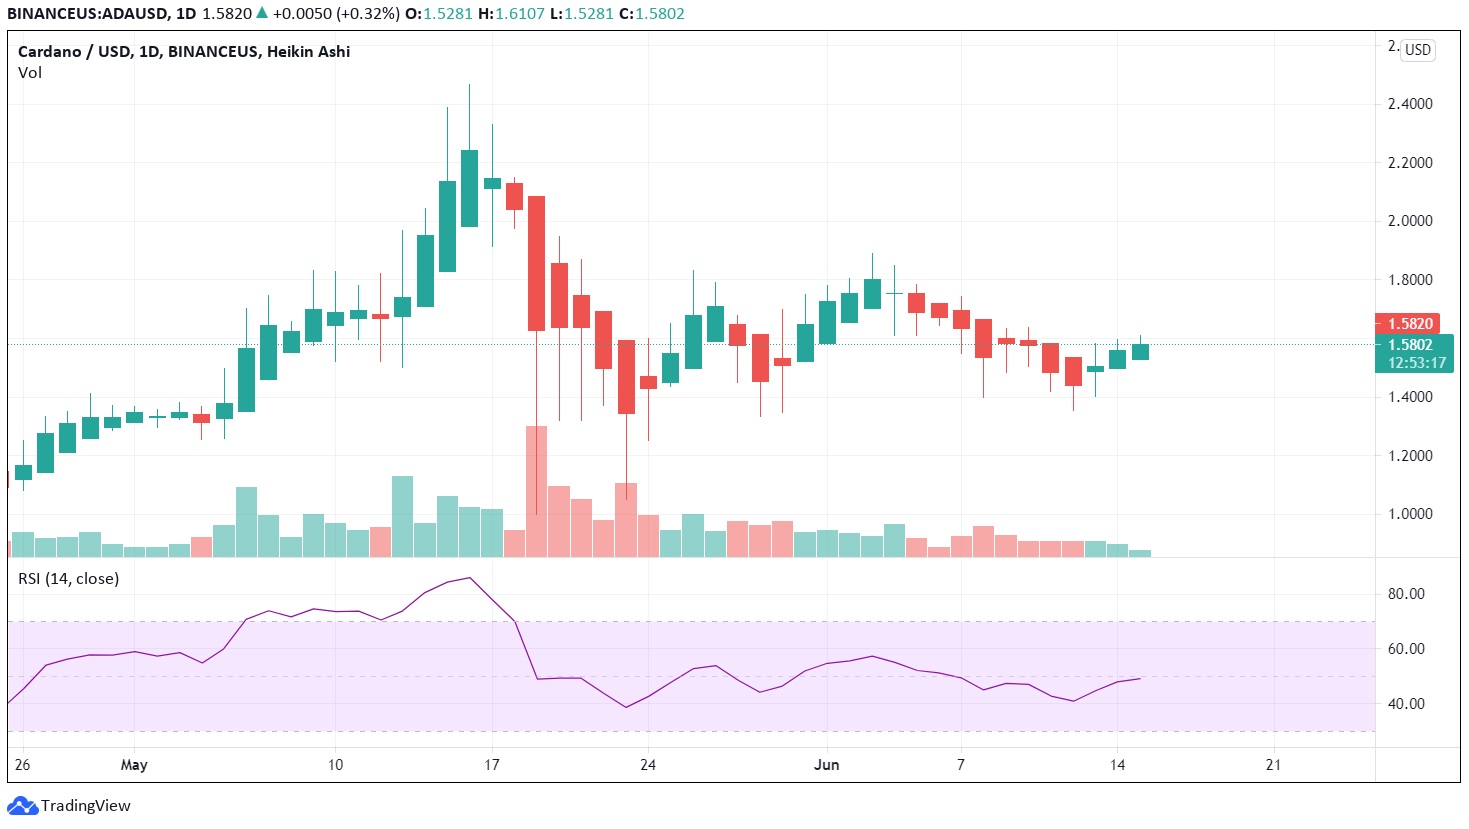
ADA has been trading in the same consolidation zones for the last month and is facing some difficulty in crossing $1.6 levels. After taking support from $1.35, it is currently headed to test the current active resistance placed at $1.66. Only after crossing this level on daily charts, investors of ADA coin can aspire to reach a monthly high. Given the positive upswing, the price action at these levels will be instrumental in plotting the further price progression.
But if ADA fails to cross the levels in the current rally, we can witness another profit booking, which can push it down to $1.35 levels. Currently, the support is visibly active at $1.28 and any downfall should be restricted by buyers at these levels. On the other hand, the $1.90 level is strong resistance to break and the zone between $1.6 to $1.9 will face some stiff flak.
Advertisement
On technical levels, we witness the price action to work alongside the 100 day moving average line. While the 50 days moving average line will act as a physiological barrier. MACD can also plot a golden crossover signifying a potential move. Overall the valuation is in a dead zone, before reaching either of the levels traders can take reverse trades. The current scenario will require some significant rise in volumes to retest the high of $1.9.
Heiken Ashi is the best chart pattern for individual traders and investors who like to work with price action. Derived with the mathematical evaluation of previous candles, these charts are a clear indication of the potential momentum. Currently, we see an end to an eight day long selling streak with a significant strong candle on the charts. Heiken Ashi formed two follow up candles with a higher high wick and no lower shadow. This indicates a positive price action that seems strong.
RSI on the other hand is trading close to 48 on the histogram, which makes it an even better scenario to buy some ADA coins. The rising RSI histogram adds to the investor sentiment of upcoming highs in this crypto counter. If this price action continues we can hope to see ADA reaching the highs of $1.9.
Hourly charts on Heiken Ashi are clearly showing a cyclical pattern to reach new highs. With every bottom or red candle made on hourly charts, the next one is a bit higher indicating positive buying even on smaller time frames.
Even with red candles, ADA is making higher lows indicating highly positive sentiment. The only out of place indicator is the RSI, which shows above 60 levels on histogram indicating overbought zones.
Advertisement
Based on our Cardano price prediction, investors can positively enter a trade in ADA if it sustains the previous lows of $1.55. Our recommendation would be to trade with caution as the market seems to be instigated by Elon Musk tweets.


