The DigiByte ecosystem is built with an emphasis on speed and security, which are often identified as limitations on different blockchains. DGB uses a proof of work algorithm to validate and complete a transaction.
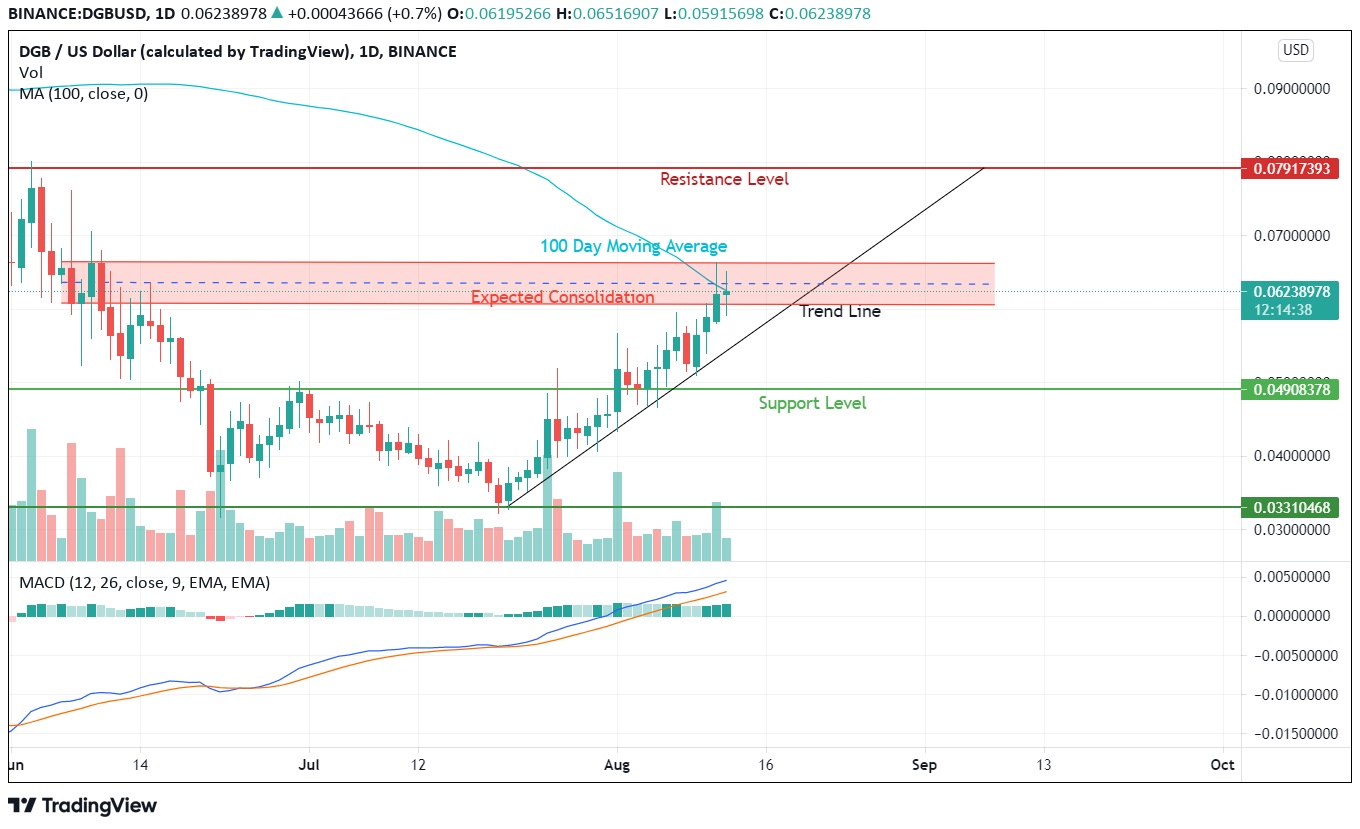
With a strong price action witnessed on DGB, we can expect it to reach 10 cents valuations shortly. The current DGB price is facing some resistance from its 100 DMA that has coincided with the wicks on daily chart candles.
DigiByte Price Analysis

DigiByte has an active support range at $0.0500 levels on the immediate downside and resistance at $0.0791 levels. In order to remain in trend there needs to be some profit booking or consolidation, straight-line upside momentum often carries the risk of sudden profit booking induced by some new development.
Advertisement
DGB is for now trading in a bullish zone with immense buying interest. The MACD indicator shows chances of the rally to continue without consolidating but, DGB should halt its rate of progression in between to continue with the upside movement. Its 100 DMA comes out at around $0.06252 levels.

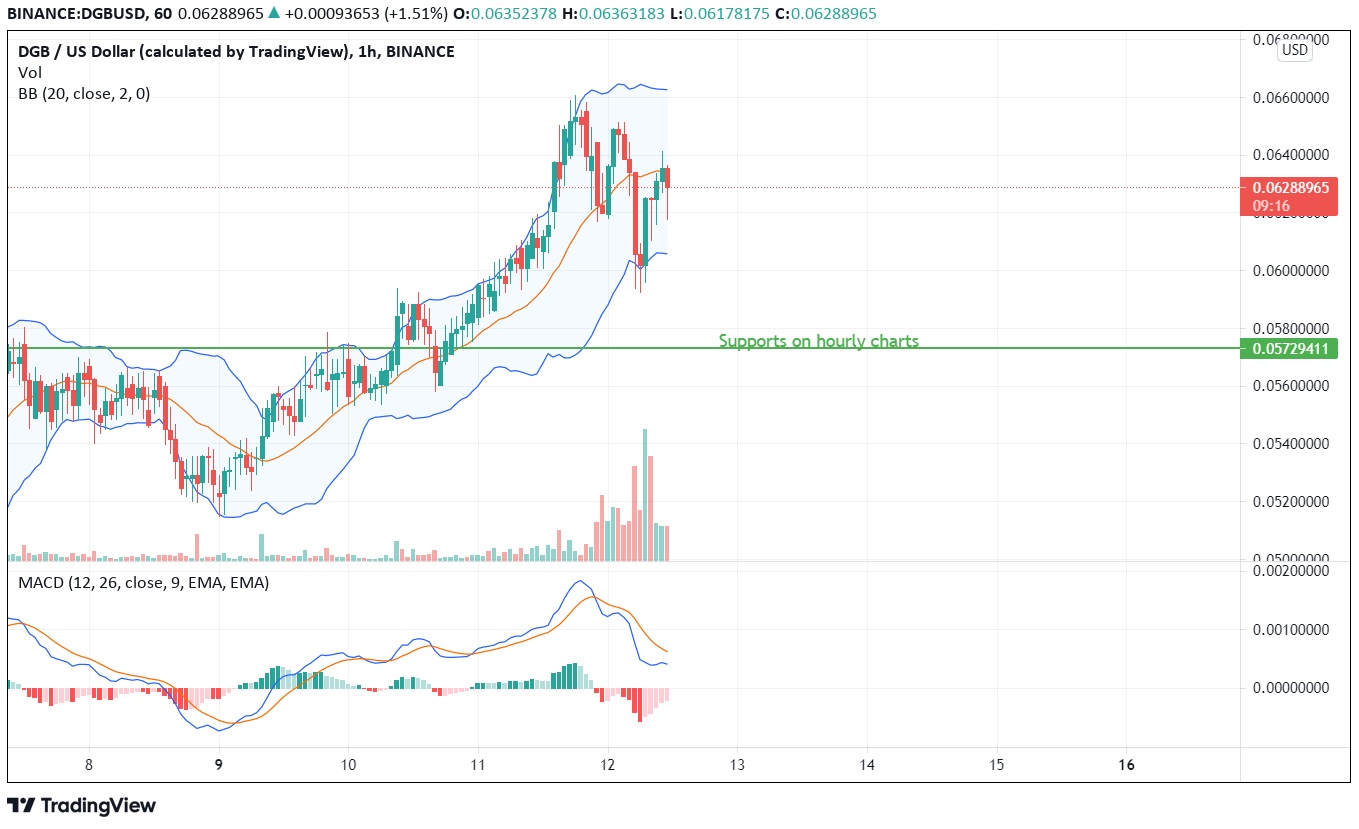
DGB shows an immense increase in volumes over the last few hours indicating increased participation from buyers and sellers of this cryptocurrency. As MACD is nose-diving towards the red zone we expect some retracement from current levels and a second attempt at breaking the recent high created at $0.066 levels based on our DigiByte forecast.
Advertisement
Support on hourly charts comes out to be at $0.0579 with Bollinger Bands hitting newfound volatility. The widening of Bollinger bands indicates scope for higher volatility and continuation of the upside movement. For now, DGB seems to have taken support from the lower end of the mean average line and faces some turbulence at the mean average line indicated by red.


