This content has been archived. It may no longer be relevant.
Verge might be shaped under the bears’ trend, but it is definitely working on visualizing the transactions on many retail stores. However, this might not have affected the capitalization in the market, but it is surely winning the trust of users who might be using Verge currency for daily transactions in the retail stores soon.
Needed to goto @Staples today to pick up a micro SD for my @ellipalwallet . Watch the video to see how I #paidwithcrpyto with my @PaycentGlobal #creditcard.#XVG and #paywithverge is going to be exciting pic.twitter.com/yt9ejbBBWW
— Verge Currency Canada (@VergeCanada) July 1, 2019
Price Analysis of Verge on 3rd July 2019:
Verge is currently trading at $0.007521 at 08:33 UTC as on 3rd July 2019. The remaining essentials are as follows:

- Return on Investment: more than 9000%
- Market Ranking: 72
- 24 Hour Volume: 2,513,778 USD
- Market Cap Value: 118,624,979 USD
- Total supply/ Circulating Supply: 15,800,603,179 XVG/ 15,800,603,179 XVG
- 7 Day high/ low: 0.009641 USD/ 0.007210 USD
Verge Price Comparison:
Advertisement
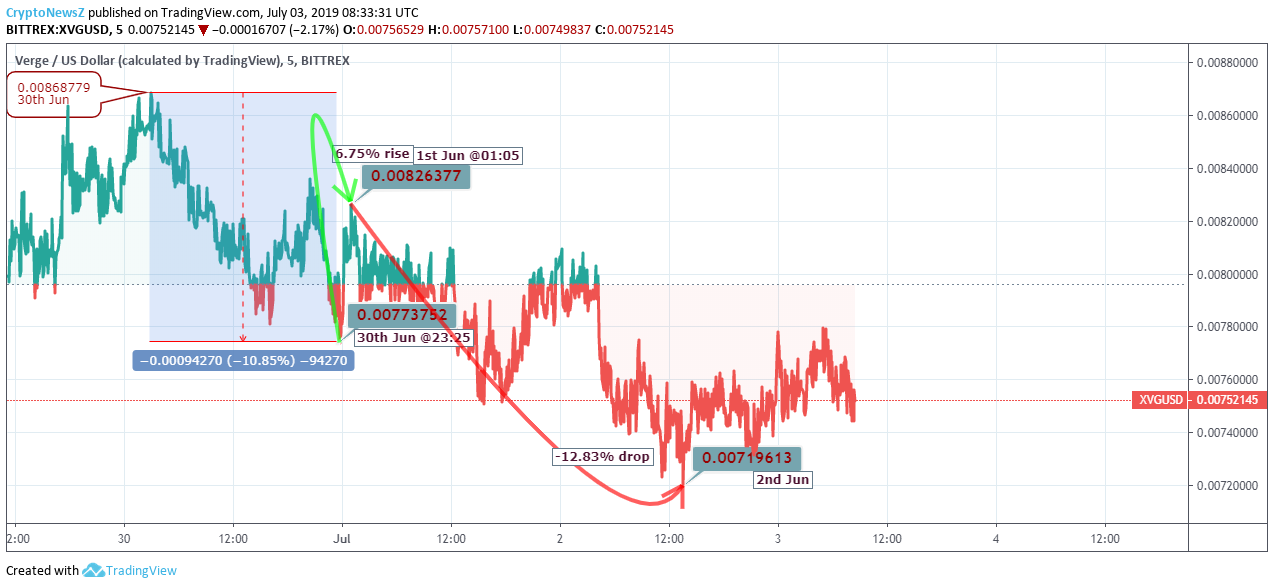
Considering the data from the past 5 days, the highest was seen on 30th June with a trading value of $0.008687, which then reduced by 10.85% around 23:25 UTC. But the upsurge was seen in just a few hours when the value was increased by 6.75% trading at $0.00826377 on 1st July at 01:05 UTC.
At the onset of this month, the value saw a further reduction with the lowest of the said time frame with the trading value of $0.007196, which was a drop of 12.83%.
Verge Price Prediction and Conclusion:
Advertisement
Verge might have promising long-term returns; however, traders do not seem to be too convinced with the same. Verge is trending in the bearish zone from quite a few days now, which means traders need to play a safer bid towards the ‘buying’ zone. The calculated resistance level and support level is between $0.00843 and $0.00688, respectively. Want to know more about whether it is the right time to invest or not then visit here.


