This content has been archived. It may no longer be relevant.
VeChain leaves behind IOTA as it shows a clear rise in the price and a steep price trend of VET against the US Dollar. VeChain, which was trading below $0.0100 at the month’s onset, is now seen trading with a clear spike as it trades at $0.015. VeChain, after having gained enough impetus in the first half of the year, is now gaining back the lost traction after a clear downward correction in the past two months.
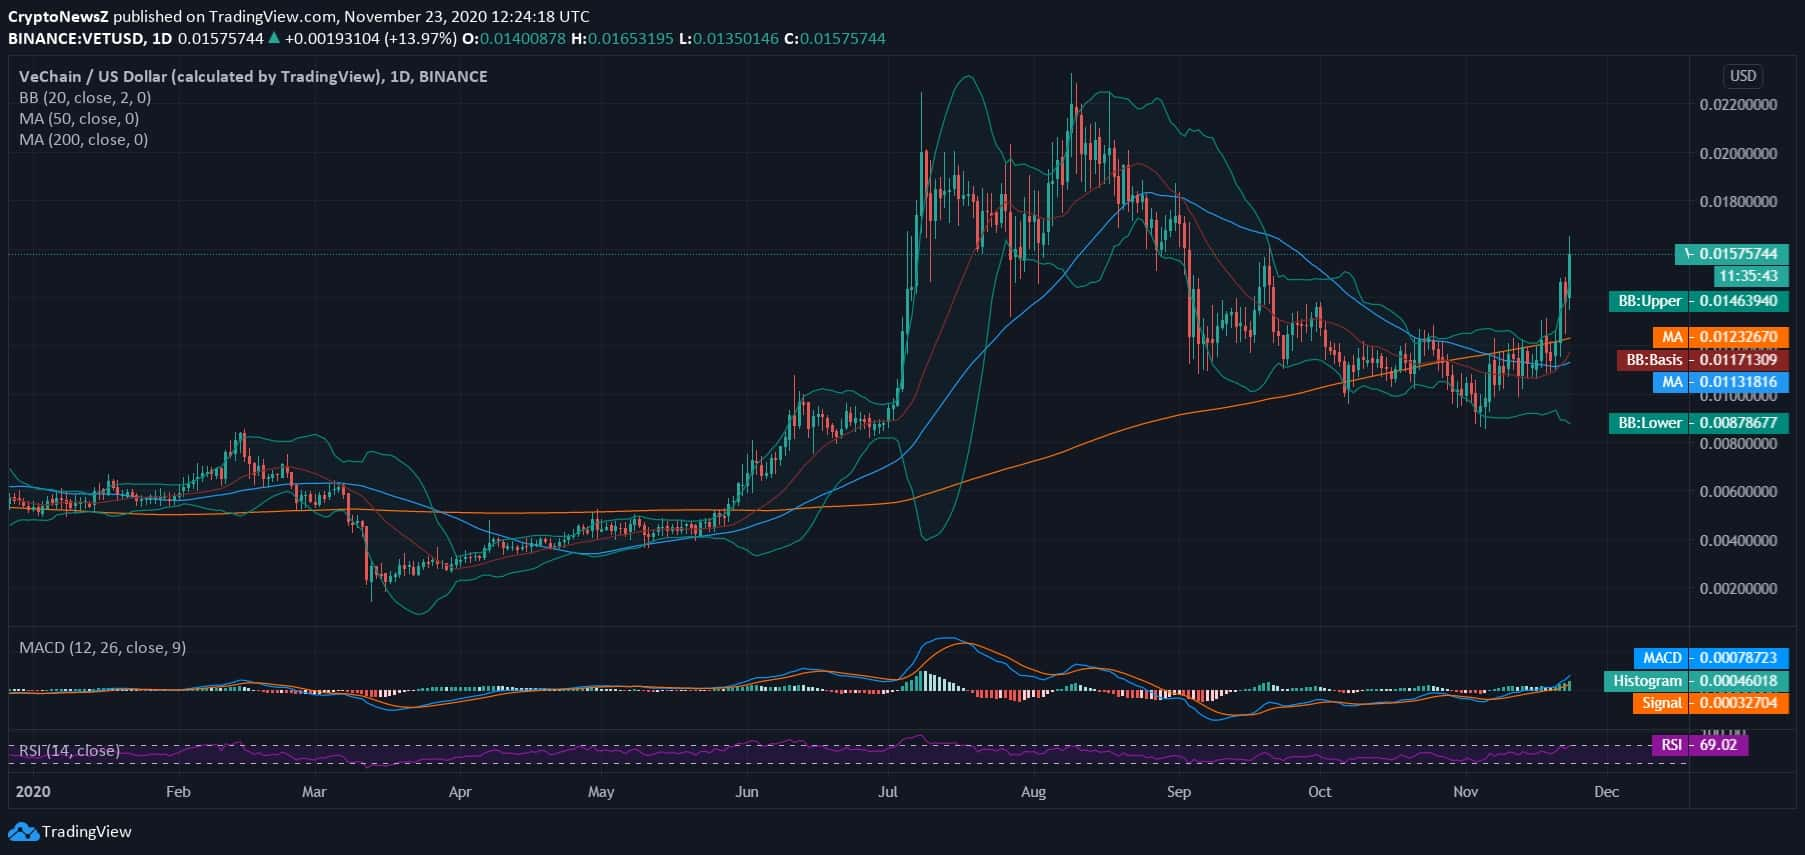
VET price started gaining after having tested 4-month support as low as $0.0085 and has notably strengthened by approximately 85% in less than 20 days against the US Dollar. And, if the coin continues to trade with a hiking spree, it is likely to cross the major resistances at $0.100 too.
VECHAIN to $1 in the bull run? I’m packed and ready 😎🔥$VET
— Ecosse Crypto 🏴 🇬🇧 (@Ecosse_Crypto) November 22, 2020
Advertisement
Moreover, as per the recent VeChain news update, the platform is gaining an edge as it has secured the prestigious Innovative Green Technology award at the China Green Economy Summit 2020 in the last week. It is a positive remark that VeChain is known amongst the large-scale government hosted events.
We've won the prestigious Innovative Green Technology award at the China Green Economy Summit 2020!
We're proud that #VeChain is recognized in large-scale government hosted events. Our Project Manager Luke Tang gave a speech about our #sustainability solutions on stage as well. pic.twitter.com/JzbeTXI6vR
— VeChain (@vechainofficial) November 16, 2020
As prestigious is the platform, the VET price dynamics are just hitting the right chords.
VeChain Price Analysis

Today, the VET price was seen trading above $0.0100 at $0.0157 after a steep rise where the price trend is seen hitting the upper Bollinger Band on the daily chart. After a clear rejection from the YTD high, VeChain price pulled back as low as $0.0085.
Advertisement
With a steep rise, the VET coin is seen reclaiming active support from 50-day and 200-day daily MA at $0.0113 & $0.0123, respectively. The MACD indicator also reflects the bullish crossover as the MACD line crosses above the signal line after the price started rising above $0.0100. The RSI is breaching the overbought zone at 69.02 and is clearly showing an increase in demand.


