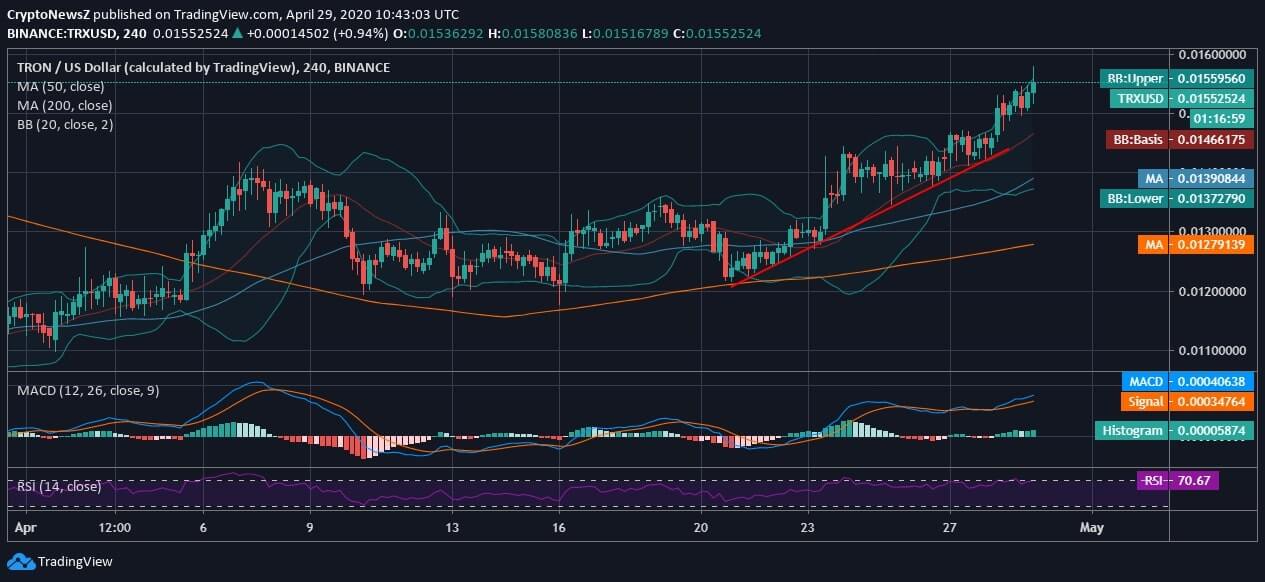
- Tron, at the time of penning down this analysis, was trading at $0.01559, with volatility in hand yet retaining steady support at $0.0139 and $0.0127 from 50-day and 200-day MA, respectively
- The 20-day Bollinger Bands are seen widening which rightly point towards the upcoming volatility
- Moreover, there is even an uptrend visibly drawn since April 20, 2020, when TRX coin from $0.01213 to currently trade above $0.015
- The intraday also holds a bullish crossover as the candlestick break above the upper Bollinger Band
- The RSI lies around the overbought region highlight the daily price pump as the coin marks a fresh 30-day high, towards the end of the month
TRON Price Analysis

On a 4-hourly chart, Tron is trading with a bullish momentum and draws a noticeable uptrend after a brief price accumulation in the second week of the month. The RSI of the TRX coin is hitting around the overbought region as the momentum remains undeniably positive after it persistently crossed $0.01300. The bulls have distinctly taken over the bears and have turned out to be strong as Tron marks consecutive higher highs. The entire month has been a gainer for the investors except for a brief hit of accumulation and choppy market.
TRX price trend has notably broken the downward channel, and therefore, there is no limit to the new fresh highs that the coin can hit. This could possibly be the best time for the investors to plan their TP (Take Profit) for those who longed during late December 2019 or the first week of March 2020. With bullish waves and a hit of volatility, a short-term investment can turn out to be a gainer, as per TRON price prediction.


