This content has been archived. It may no longer be relevant.
- TRON faces rejection above $0.0182 as it falls in $0.016 trading zone after oscillating midways
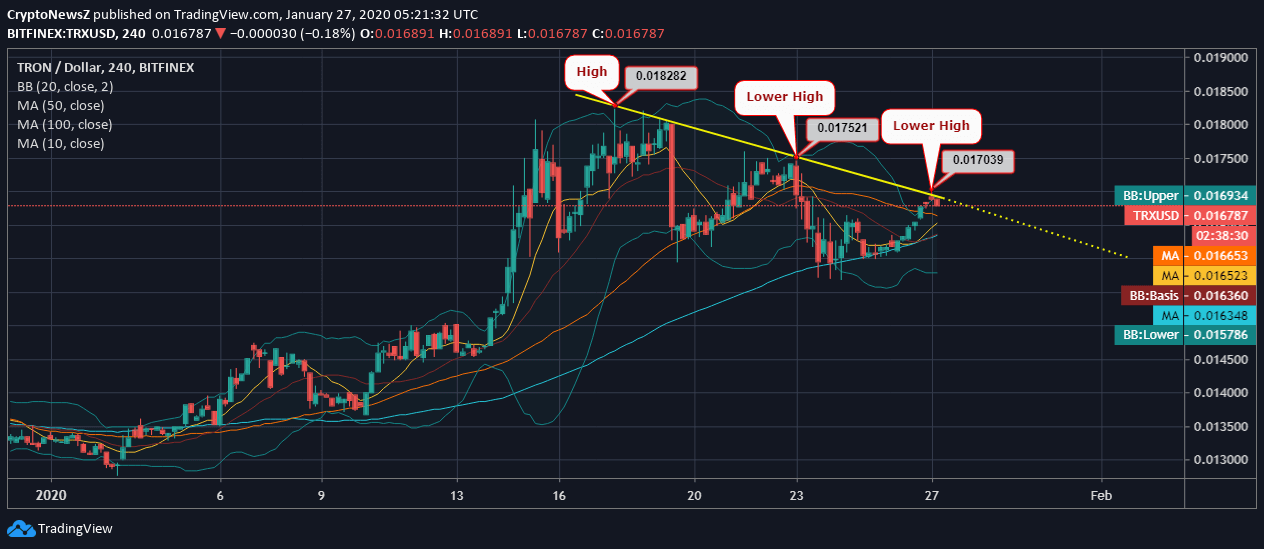
- The relaxing slide that the coin is facing has immediate support awaiting at $0.0162 i.e., the 100-day daily MA
- TRX against USD breaches through the selling pressure as it had hit a fresh 30-day high over the fortnight
- Despite the current price correction, TRON price gains support from the imminent moving averages
TRON price trend projects a further fall as the coin fails to keep up with the pace that it gained in the past 15 days after despairing trade towards the end of the previous year. The current trading price is rightly supported by the daily moving averages, and therefore, we do not project any unpredictable volatility in the upcoming days.
TRON Price Analysis

Analyzing the given 25-day 4-hourly movement of TRX/USD on Bitfinex, we see that the coin has been experiencing a downtrend as compared to the early half of the month. According to the current movement, TRON crypto is dipping as it gives consistent lower highs from trading around $0.0182 to current trading at $0.0167. Moreover, the price of TRX has rebounded twice from $0.01600, followed by $0.0162. The 20-day Bollinger Bands laid show a moderate width and do not project volatility in the upcoming days. According to the TRON coin price prediction, the current trend might continue for the short-term.
Advertisement
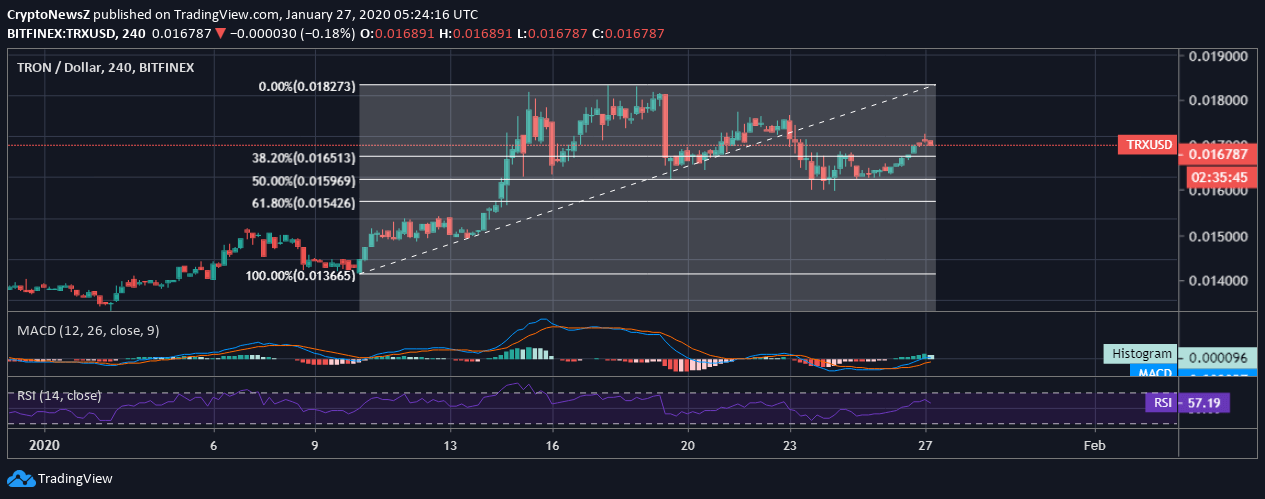
The current trading price of TRX coin is approaching support at $0.0166 i.e., the 50-day daily MA followed by the 10-day MA. The price trend is hitting the upper 20-day Bollinger Band as it moves above the 38.20% Fib Retracement level. If the coin continues at the same pace and trend, it is likely to go even lower.
Technical Indicators
The other technical indicators confirm the intraday oscillations as the coin gives consistent lower highs and the MACD of TRON holds a bearish divergence as the signal line overrides the MACD line.
Advertisement
Alongside, the RSI of the coin is at 57.19 and is seen nosediving a bit but is still away from either extremity.


