- TRX coin exhibits an up-trending momentum since the start of the year as it gains the required pace and support
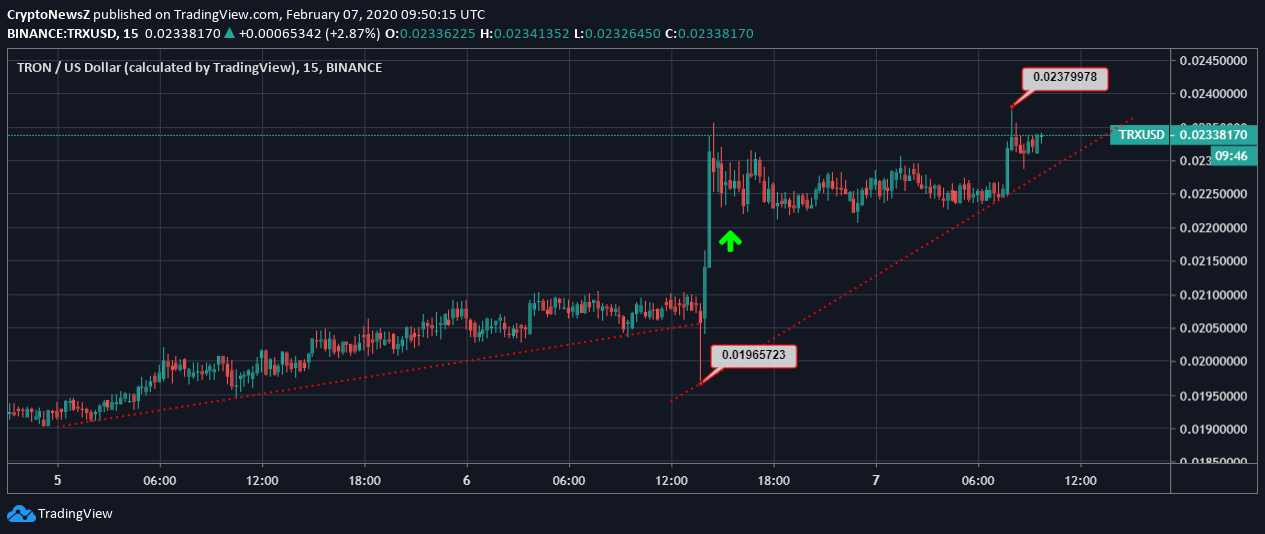
- Moreover, the intraday movement has helped the TRON coin to gain over 20% as it currently trades at $0.0233
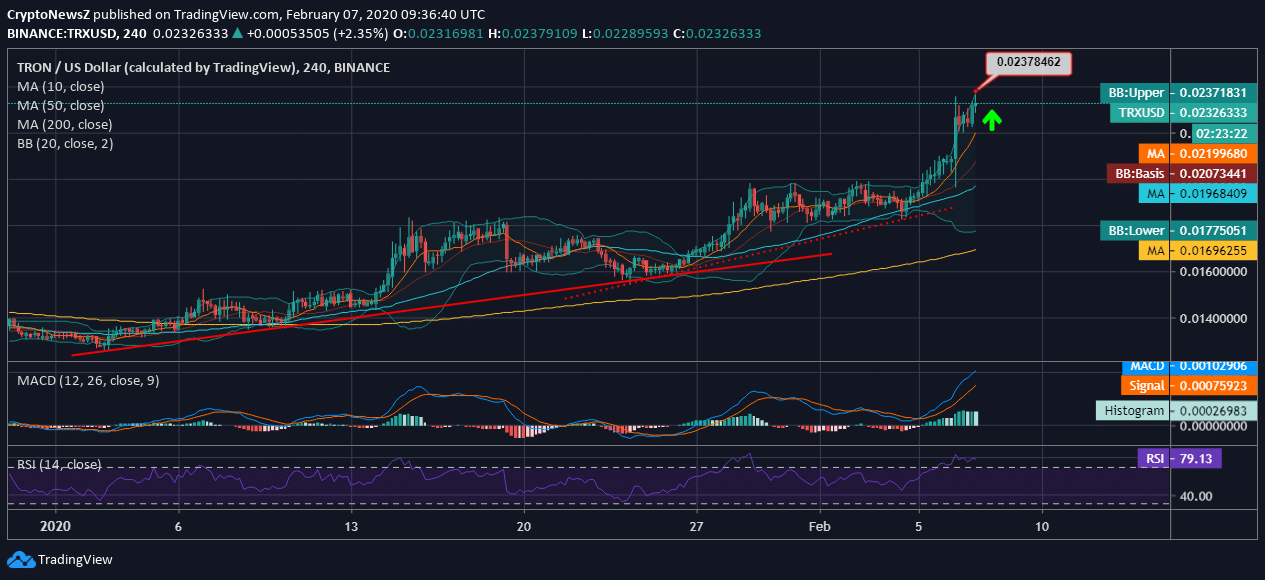
- The steep rise that happened yesterday is projecting towards near-term volatility which confirmed by the 20-day Bollinger Bands
- The utmost support awaits at $0.0219 by the 10-day daily Moving Average
- Selling pressure disappears, and the RSI of the coin lies at 79.13
Advertisement
TRX, just like Bitcoin and other altcoins, is seen making a powerful comeback after having a despairing end to the previous year. The current pace is likely to stay, and as we foresee a growing trend over a certain period due to real-time support.
TRON Price Analysis

Taking a glance at 4-hourly TRX/USD price movement on Binance, we see that the currency is hitting above the upper 20-day Bollinger Band with an expanded width of bands, hinting towards upcoming volatility. TRON cryptocurrency is on a continual upswing as it is rightly supported by the daily moving averages, and the 200-day MA is lying below the lower Bollinger Band, providing support at $0.0169. The intraday positive crossover has been quite a need of the hour which has rightly hit all the resistances and manifests a fresh 90-day high.
Aligning the cumulative growth with the intraday growth, we see a steep rise and an uptrend forming as the coin trades from the low of $0.0196 to an intraday high at $0.0237 and beyond.
Technicals
The MACD of TRON is overriding the signal line as it cuts the signal when the price hit a fresh 90-day high and exhibited over 20% intraday growth.
The RSI of TRX coin is at 79.13 and is fluctuating in the overbought region due to an intraday hike. According to TRX forecast, the coin might continue the uptrend in the upcoming days.


