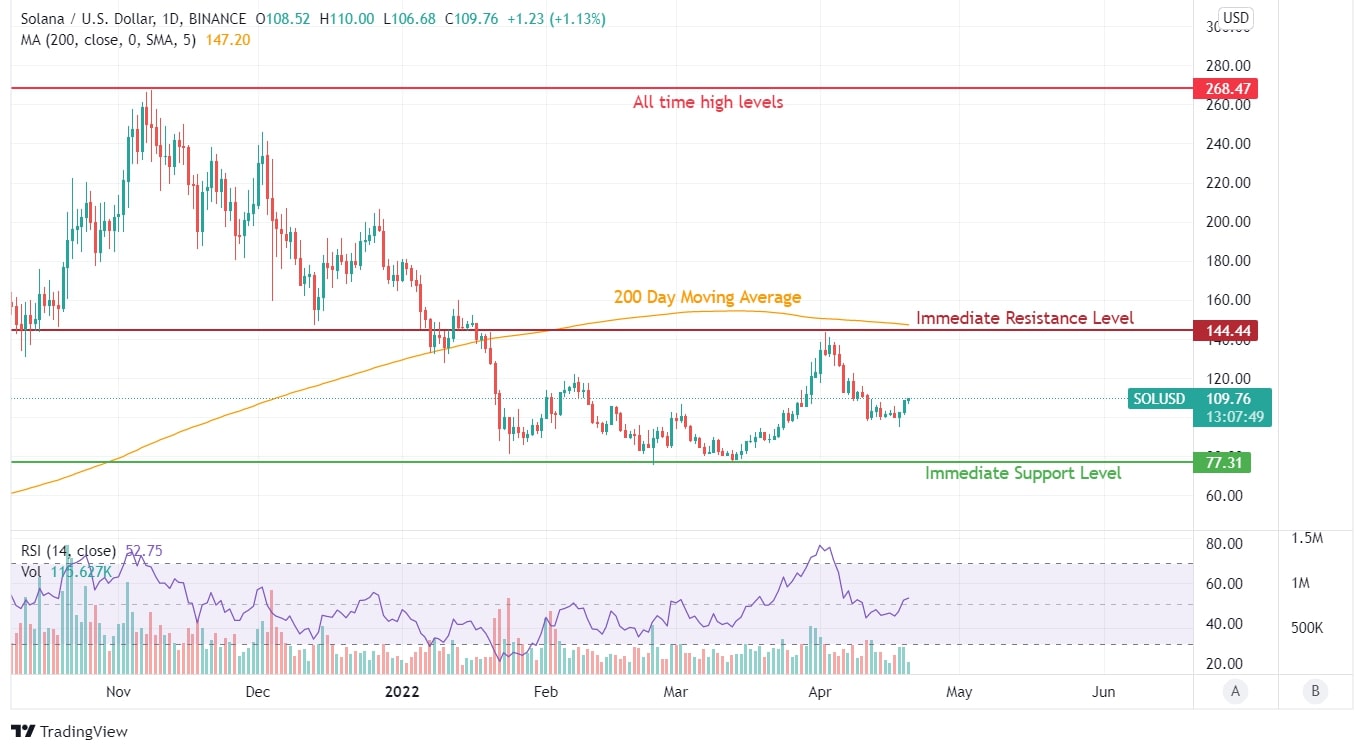
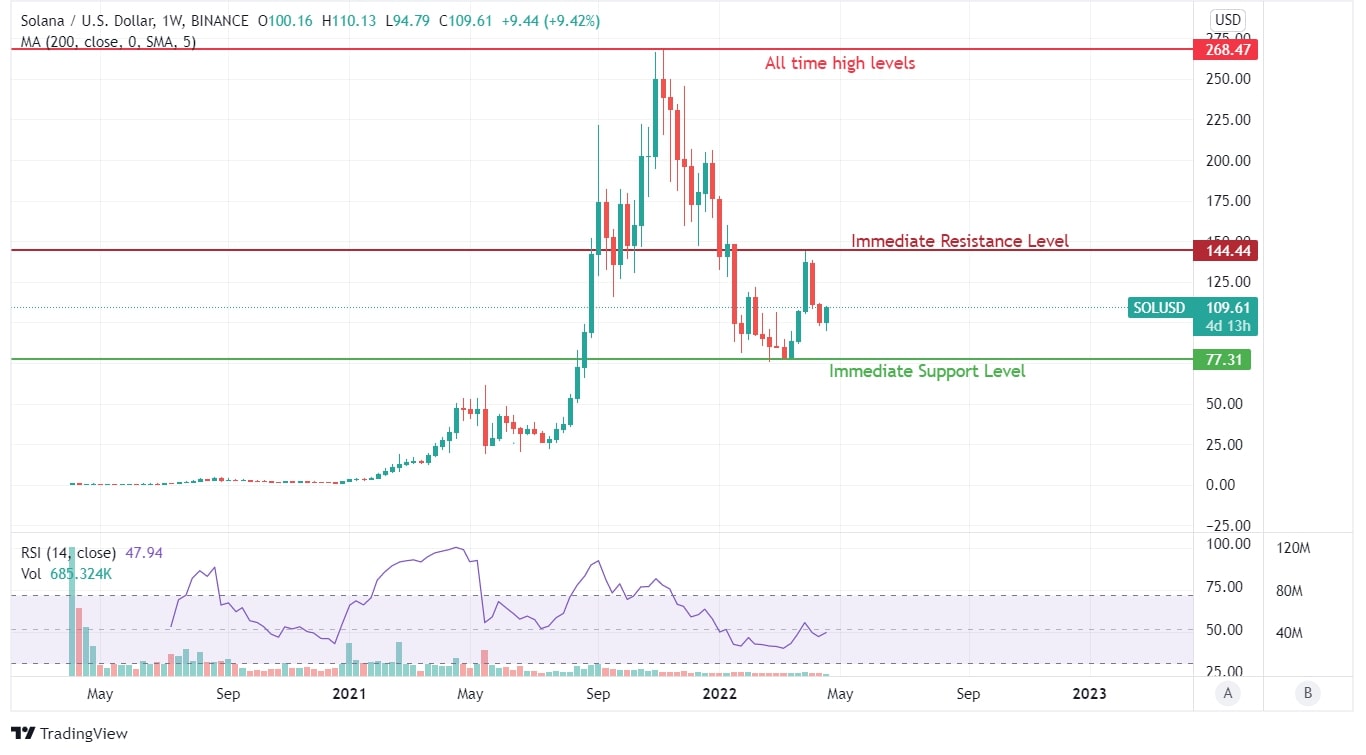
Amongst the lost list of cryptocurrencies, Solana has been one of the dominant ones to take its place among the top 10 cryptos. The current price trend is weaker as Solana is between its immediate resistance at $144 and immediate support at $77.
A sudden spike from $94 to $110 shows a higher low chart pattern for SOL, which could further aid in surpassing the strong resistance zone of $150 and 200 Days Moving Average curve; once these two levels are breached, SOL will emerge amongst the market leaders.
Solana’s price trend is more like a vast profit booking but still showcases a strong potential. The breakdown level of mid-January 2022 has emerged as a strong resistance that could halt SOL’s price action in a narrow zone. Read more here for the best SOL forecast and future price action.
Advertisement
A closer look at the price trend shows Solana being pushed away from its all-time high of $260 but getting consistent buying spikes. While buying spikes are good at the moment, Solana’s RSI indicator shows a different story. RSI can be seen climbing towards overbought zones just as the prices have taken support midway on its decline.
Ideally, one should not wait for Solana (SOL) to breach the $150 level range and invest in this crypto with some space that could allow for a better averaging price even if SOL fails to breach the 200 DMA curve in a single attempt. 
Advertisement
There is a close clash between buyers and profit bookers, but profit bookers will eventually lose. The moment SOL gets a clear ground and overtakes $150, there seems to be no resistance even in the price trend before the $200 levels. The trading range between $150 and $200 is bound to be intense and full of sudden rallies for SOL.


