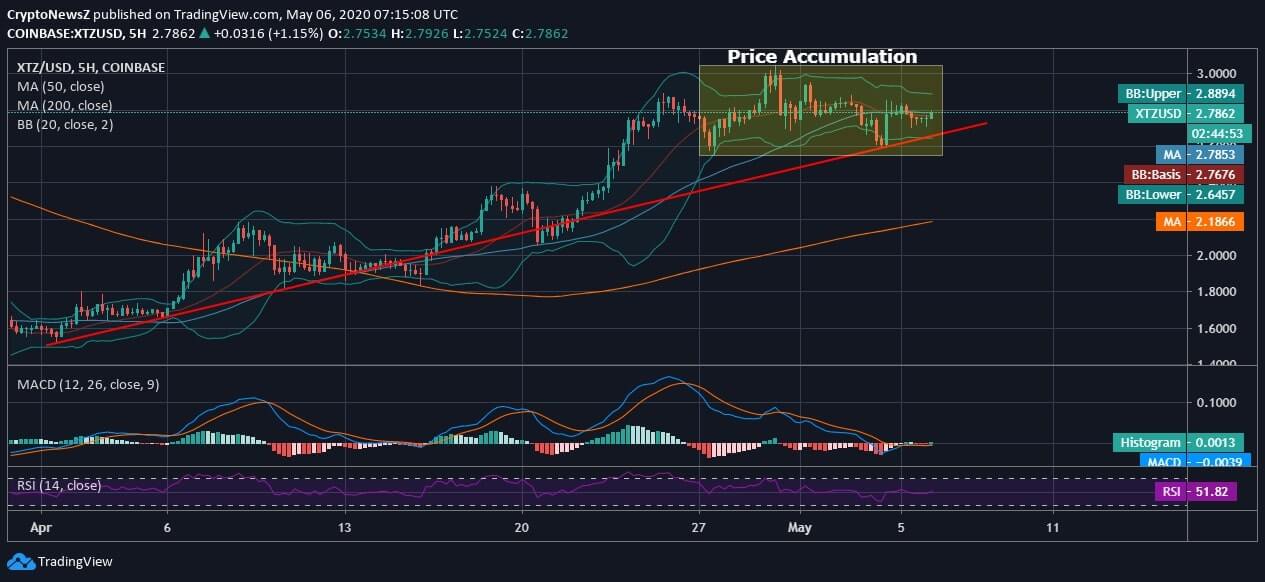
- Tezos, at the time of penning down this analysis, was trading at $2.78 and appeared like price accumulation, otherwise is also seen drawing an uptrend over the past month
- XTZ/USD retains support from 50-day and 200-day MA; however, a further dip will lead to losing support from 50-day MA
- The 20-day Bollinger Bands do not project any unprecedented volatility in the upcoming days
- Although, the MACD is seen drawing a bearish crossover since the price turned down below $3.05 at the last trading day of the previous month
- XTZ price was seen oscillating higher for the entire previous month until the bear broke in with volatility in the market
Tezos Price Analysis

Advertisement
On the 5-hourly chart, Tezos coin is drawing complex trends as the price accumulates amidst the uptrend drawn over the past month. The 20-day Bollinger Bands laid are not exhibiting any unprecedented volatility as it neither expands nor squeezes in the given time frame. Moreover, XTZ coin is holding a bearish crossover on the MACD chart since the last week of the previous month, with a single instance above $3.
Advertisement
The ongoing month started with an ignored momentum as Tezos has been trading below $3 over the past six days now, until the time of writing. The intraday has been lacking enough momentum for a bullish rebound and breakout above the 20-day upper Bollinger Band.
The RSI of XTZ is at 51.82 and appears flat due to a lack of steady momentum yet is away from either of the extremities on the hourly chart. Check out our Tezos predictions to get more details about possible price levels for the near future.


