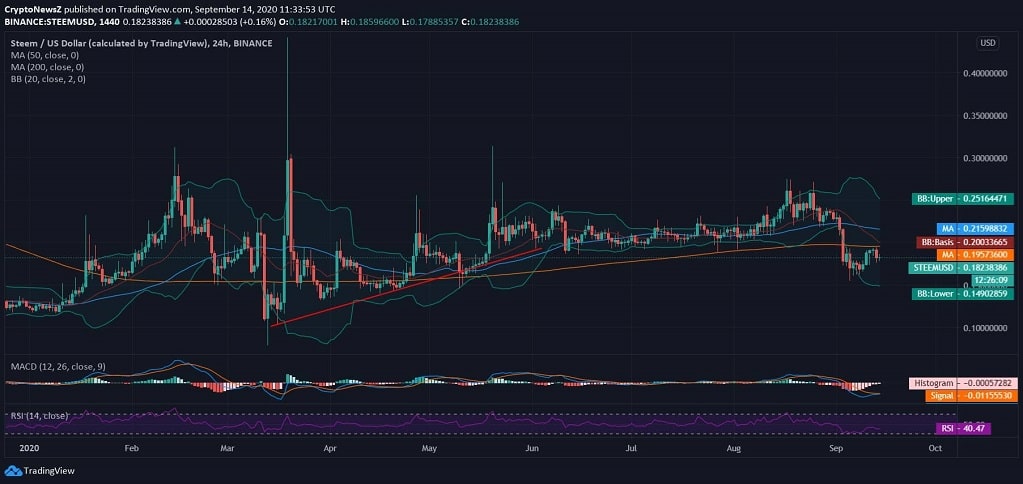
STEEM, at the time of penning down this analysis, was seen trading at $0.182 against the greenback. STEEM price declined after a notable price consolidation until the beginning of the previous month when it reclaimed a 3-month height briefly.
However, the currency lost all the farfetched gains at the onset of the ongoing month with a bearish candlewick extended straight below $0.20. Steem, however, has experienced bullish candlewicks in the first half of the year with the highest marked above $0.40 at $0.42.
STEEM Price Analysis

Advertisement
STEEM, at the press time, was trading at $0.182, and after breaching the lower band with the recent lows hit, it appears strengthening in the intraday against the US Dollar. STEEM/USD holds no support from the MA50 & MA200 after gradually declining from a $0.25 price area. However, the Bollinger Bands appear slightly widened with calculated volatility in the near-term.
After a gradual uptrend from the YTD low marked at $0.079, the Steem coin started exhibiting a flat trend against the greenback on the daily chart. However, the price has notably amplified by over 130% in 6 months from the lowest to the current trading price.
Advertisement
Since the STEEM price trades below $0.20, the MACD indicator draws a bearish divergence on the daily chart, and the RSI is also inclined towards the support area at 40.47.


