There has been a strong buzz around the Solana blockchain and SOL cryptocurrency. As SOL skyrocketed in value in 2021, it moved from close to $1 to make an all-time high of $61. The intention of Solana to revolutionize the DeFi network is the core sentiment behind the buzz in Solana.
Solana Technical Analysis
SOL cryptocurrency projects a strong vibe on the charts, and its technical analysis indicates a phenomenal belief of investors in this currency and its blockchain. Only only does SOL trades above multiple moving averages, but it is also supporting the trend line pattern. We will be deducing the capability and potential of Solana through our in-depth price analysis using technical indicators on multiple time frames.
Firstly, SOL is quite strong based on its traded value above the long-term moving averages. It was not spared from the major profit booking/selling scenario during the wider negative sentiment on the crypto market in May. But even with a fall in value from the highs of 60s to the immediate lows of close to 19, and despite witnessing a loss of above 66%, the value on a closing basis respected the major moving averages.
Solana took support from the 100-day moving average and tested its 50-day moving average, which is a very good sign of investor’s belief and positive sentiment on this crypto asset. For the last two weeks, Solana has been consolidating within the 100 days and 50 days moving average. That too, with a strong inclination towards breaking the 50-day moving average resistance.
Advertisement
The major support of the 200-day moving average is still out of reach from the sellers. The positivity projected by traded value remaining above the moving averages adds to the fundamental belief in Solana. For the near term, resistance and support are working on a wedge pattern. The clarity posed SOL on traded value, despite breaking the wedge support on intraday candles, SOL reverted from the support line in the daily chart.
Combining these factors, SOL should remain positive, moving along the support line trying to climb on top of the wedge resistance. Once the wedge resistance has been surpassed, the next heavier resistance placed at $50 will come into play. There is not a tad bit of weakness on this cryptocurrency, and traders can take advantage of moving average lines for making a holding entry in this asset.
On extended wedge lines, the breakout should be made around $52 levels. However, it will be interesting to witness which resistance becomes tougher for buyers and the positive sentiment on Solana.
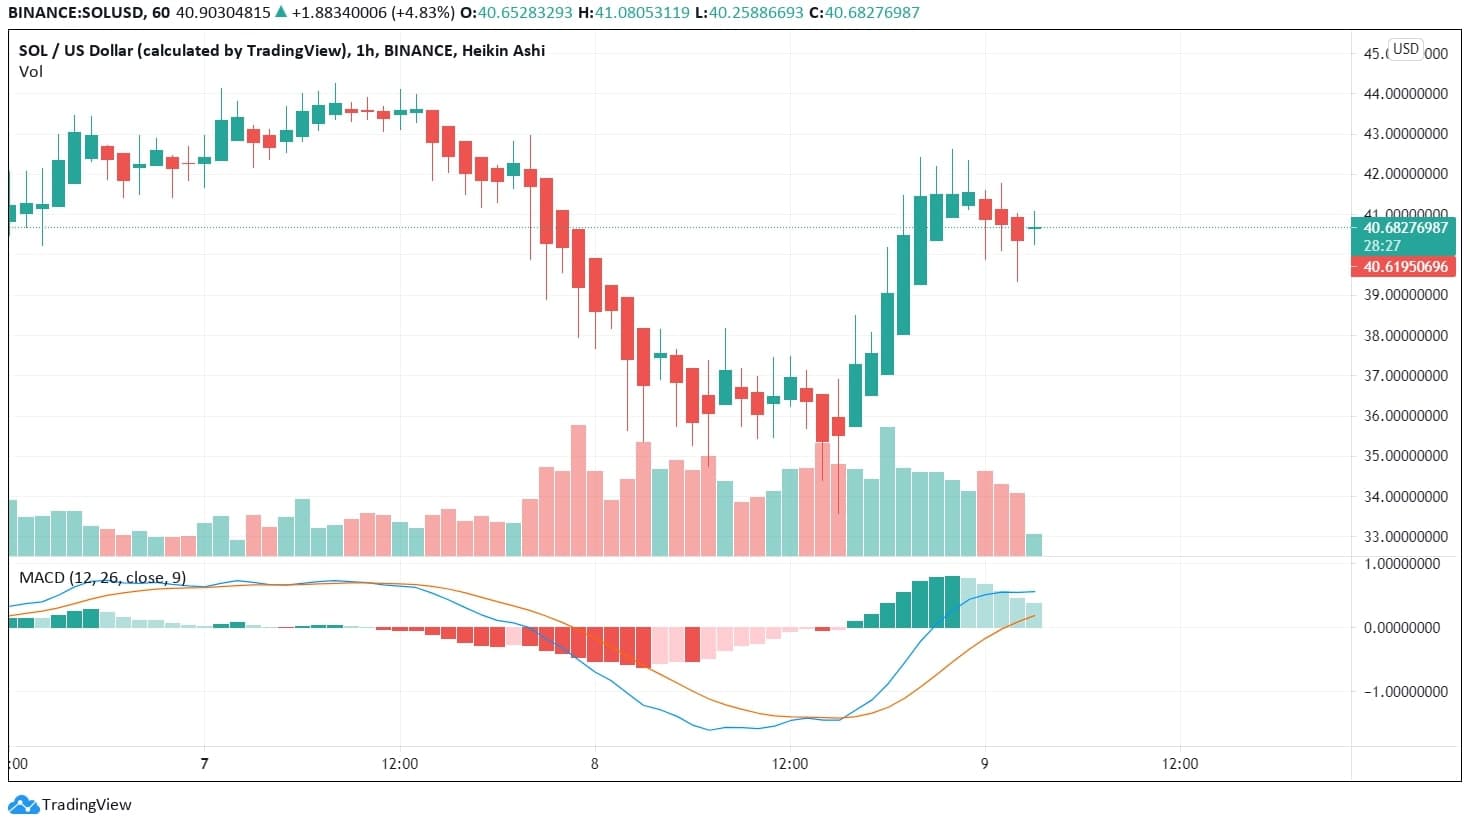
Heikin Ashi charts provide clarity on both the chart time frame momentum and the long-term momentum. On the above chart, we can witness an improper sentiment given the shadows on the daily closing value, indicating heavy volatility on short-term charts. On daily charts, the candle formed for the 8th of June dampens the consistency of positive momentum, indicating a tussle between buyers and sellers.
Moreover, as Solana is closing towards the previous consolidation zones, such candle formation would be regular, indicating higher volatility. RSI is also closing the overbought regions with the current value of 57 on the histogram. This consolidation zone between $40 to $48 also coincides with the long-term resistance active at $50. Hence, based on our SOL crypto price prediction, don’t make a substantial entry before the tussle projects a clear picture. Prices rarely trade above the 50 days moving average line, which will be moving north in the coming days.
Advertisement
Hourly charts indicate a price action in stark contrast to the one visible on daily charts. This reassures our prediction of impending or continued volatility on the prices of Solana. While the last few hours have been bumpy, the current unsure candle can be a reversal. Once the candle is completely formed, there can be a carry forward positive momentum on this counter with resistance or convergence around $44. There is a clear opportunity for 10% of profiteering from the current levels of $40.


