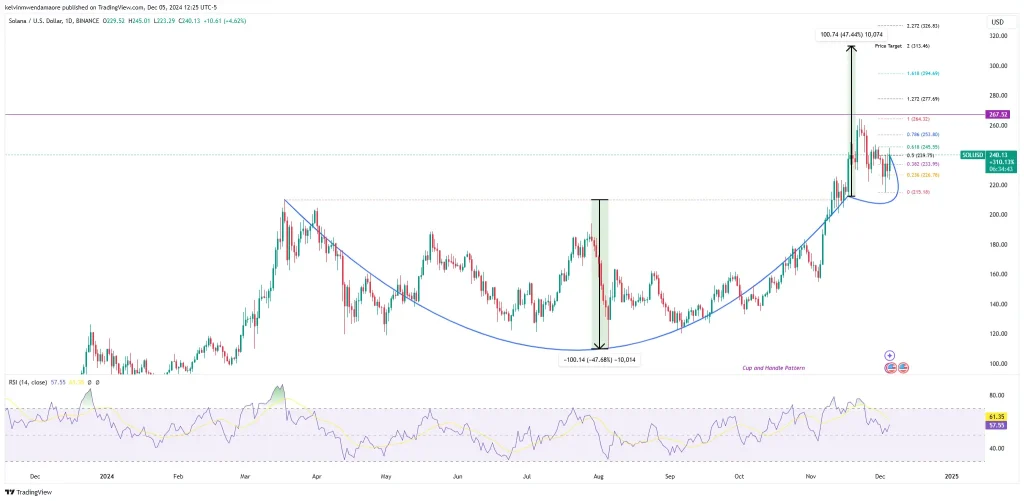
Solana’s native token, SOL, has completed a classic cup-and-handle pattern on its daily timeframe, a reliable technical formation signaling bullish momentum. As observed, the asset formed a rounded cup bottom between March and November, culminating in a resistance breakout point near $212.36. Afterward, the handle correction retraced slightly, testing key Fibonacci retracement levels, notably 0.236 around $226.78, indicating strong support.
Based on the height of the cup, the cryptocurrency’s projected price target hints at a possible 47% rally, which coincides with the 2 Fibonacci extension zone at $313.46. Notably, the relative strength index at 61.335 reveals a mild bullish momentum, with ample space for further upside before reaching overbought conditions, making Solana a prime candidate for traders targeting price levels above the $300 zone.
Strong Market Fundamentals Back Technical Momentum
The current positive outlook is supported by sturdy market inflows, where the Solana cryptocurrency recorded $1.19 billion in spot inflows versus $1.13 billion in outflows on December 5, resulting in a net positive flow. This highlights a sustained buying spree as the token traded at the $239.25 threshold.
Advertisement
Adding to this sentiment, the token’s Open Interest (OI) Weighted Funding Rate remains positive at 0.0653%, a critical indicator of continued bullish sentiment among traders. This means that long-position holders are willing to pay a premium to short ones to keep their bullish bets intact, further cementing the confidence in the cryptocurrency’s upward movement.
SOL’s Price Prediction: Experts Forecast Accelerated Gains
Raoul Pal, co-founder of Real Vision, took to his X platform to praise Solana’s weekly chart as a quintessential example of bullish strength, asserting, “$SOL… literally couldn’t be a more bullish long-term chart… when it breaks higher, it’s going to ACCELERATE.”
$SOL… literally couldnt be a more bullish long term chart…when it breaks higher, its going to ACCELERATE. pic.twitter.com/nthzQgh5uB
— Raoul Pal (@RaoulGMI) December 4, 2024
Pal’s analysis points to a multi-year consolidation pattern, with SOL testing a critical resistance level near $260—an area aligned with its previous all-time highs. The chart also reveals a breakout above a falling wedge pattern, a bullish continuation signal, reinforcing his claim that SOL is on the verge of appreciation. A decisive breach of the $260 level could propel the token into a new upward trajectory, targeting its all-time high and beyond.
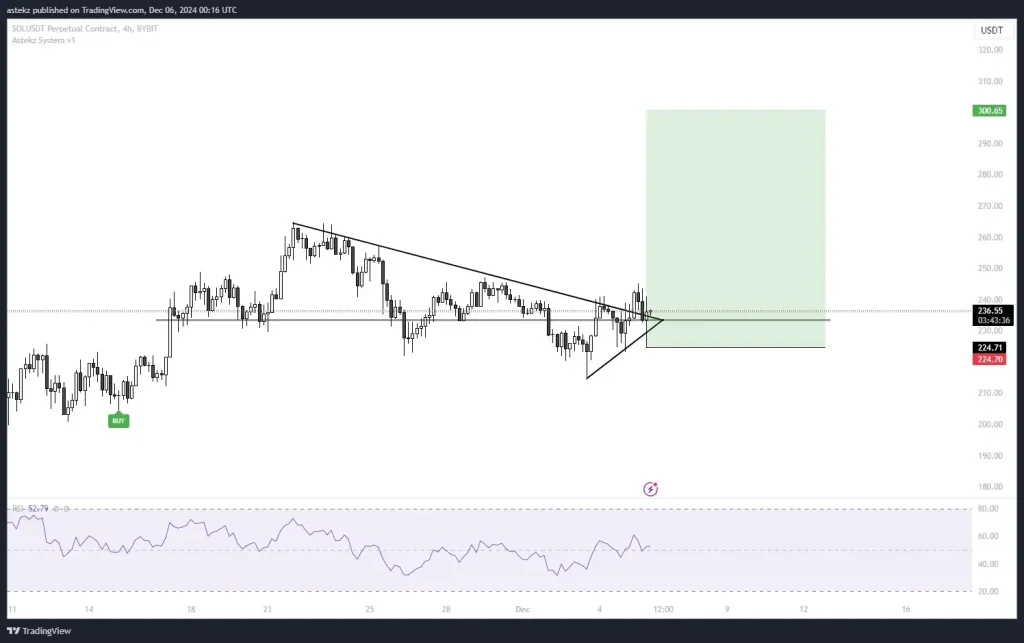
Adding to the sentiment, renowned trader Astekz has expressed confidence in SOL’s breakout potential, calling it “the biggest single W of my trading career” if the token sustains its upward momentum. Astekz’s weekly chart shows SOL consolidating just below the $260 resistance, with the token recently breaking out of a prolonged consolidation zone. He predicts the cryptocurrency could climb toward the $300 zone.
Advertisement
Also Read: Here’s Why PEPE Might Soar 27%: Bullish Signs You Need to Know


