This content has been archived. It may no longer be relevant.
Ripple (XRP/USD) Price Analysis:

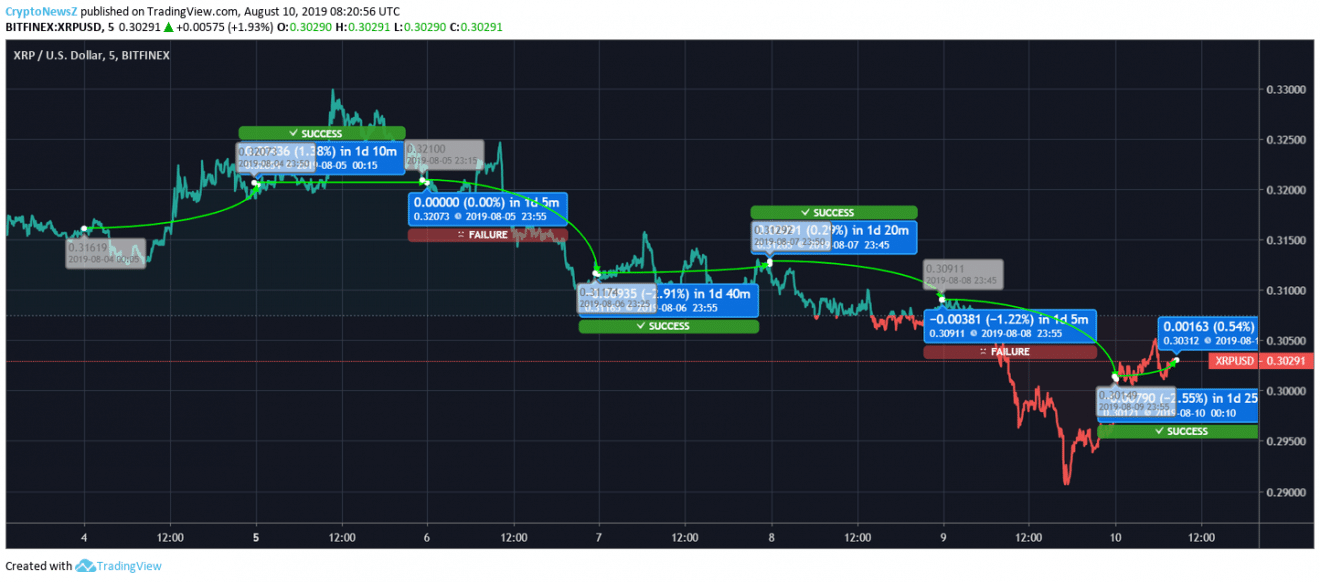
Ripple finally starts an upsurge after a tremendous fall in yesterday’s chart. The coin is currently dealing at $0.30291, and the Market Cap stands at USD 12,929,204,571. Ripple is reflecting a moderate fall in the price. Starting from 04th August, the XRP price changed from $0.316 to $0.320 and booked a profit of 1.38%. On 5th August, the Ripple coin kept it tight around $0.32. The price switched from $0.320 to $0.0321. On 6th August, the coin fell from $0.3207 to $0.3117 by 2.91%. On 7th August, the coin escalated from $0.3117 to $0.3129. On 8th August, the coin slipped from $0.3129 to $0.30911. The downtrend continued from $0.30911 to $0.301 by 2.55%. Today, the Ripple opened with an upsurge. The coin escalated from $0.30149 to $0.30312. The escalation was of 0.54%. The future of XRP coin is better, and hence investment in the wouldn’t go futile. We assume that the long-term investment would give the best results to the investors.
Tether (USDT/USD) Price Analysis:

Advertisement
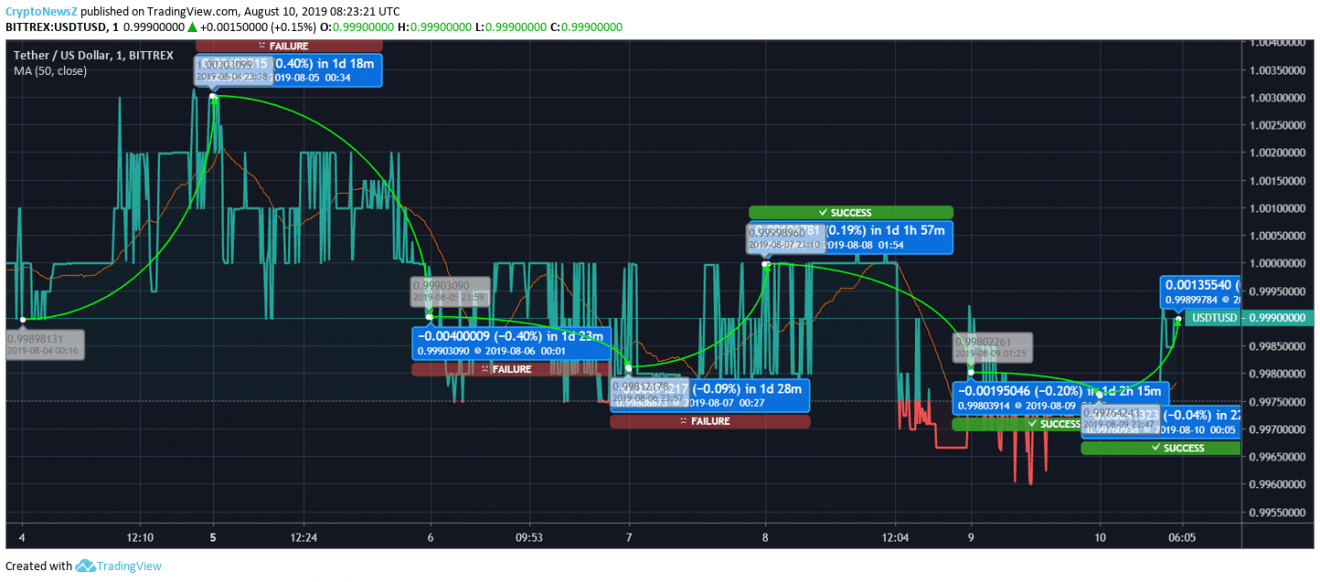
Tether is on the 7th position in the list of top cryptocurrencies. The Market Cap of the USDT coin is 4,038,834,988 USD. The last ten days have been quite volatile for the coin. We are expecting the coin to attain stability soon. To understand the momentum of the Tether coin, let’s have a look at the Tether price chart.
Above chart is reflecting downward movement in the USDT price. On 4th August, the coin opened at $0.9989 and went up to $1.0030. The escalation in the coin was of 0.40%. On 5th August, the Tether fell from $1.0030 to $0.9990 by 0.40%. The downside movement continued in the coin. The price counters changed from $0.9990 to $0.9981 by 0.09% on 6th August. Then, there was a marginal improvement in the Tether price. The coin jumped from $0.9981 to $0.9999 by 0.19%. On 8th August, the USDT again registered a loss. This time the regression was of 0.20%. The price counters changed from $0.9999 to $0.9980. Yesterday, Tether kept the same pattern and dropped by 0.04% as the price slipped from $0.9980 to $0.9976. However, today, there is a slight recovery marked in the coin. The price escalated from $0.9976 to $0.9989. The escalation in the coin is said to retain itself. We are expecting an upsurge by the end of 2019.
Binance Coin (BNB/USD) Price Analysis:

Advertisement
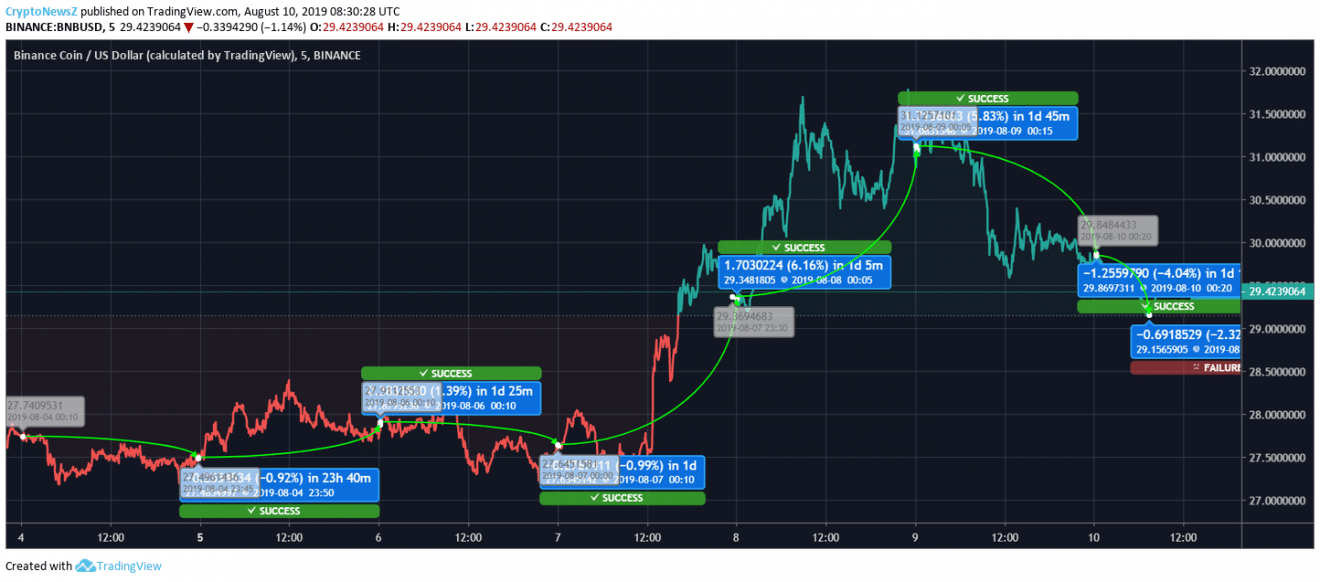
Holding the 6th position tight, Binance Coin is behaving a lot differently than the ongoing trend. When the entire market was suffering, Binance Coin was climbing. Now, when the whole market is booking profits, Binance coin price is slipping. BNB price chart is narrating the exact story. Binance Coin booked an upsurge in the last one week. On 4th August, the BNB coin opened at $27.74 and slipped to $27.49. The regression was of 0.92%. On 5th August, the Binance coin escalated from $27.49 and touched $27.91 by 1.39%. On 6th August, there was again a drop in the BNB coin price. The price switched from $27.91 to $27.64 by 0.99%. On 7th August, the coin switched places from $27.64 to $29.34 by 6.16%. The escalation continued on 8th August. The price jumped from $29.34 to $31.12. The uptrend was of 5.83%. Yesterday, the Binance coin slipped from $31.12 to $29.86 by 4.04%. Today, the coin continued the drop. The Binance coin price slipped from $29.86 to $29.15. The coin is expected to catch up with the trend in the coming week. The traders are interested in the Binance coin for a short-term investment plan to book huge profits.


