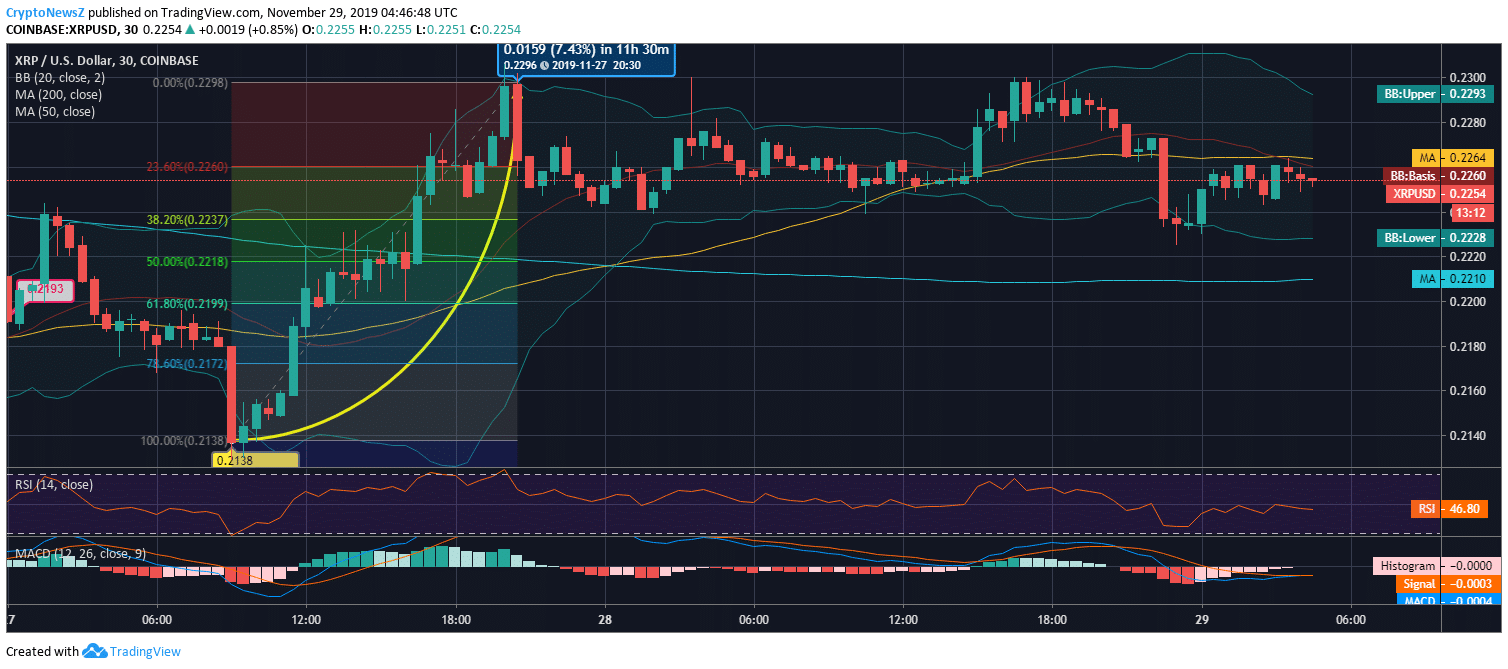
- Ripple price has been trading around $0.22 since the day before yesterday
- XRP coin seems to have a support level at $0.2138; records an increase of more than 7%
- Technical indicators are set to enter the bullish zone including the SMA lines
Advertisement
It was on November 27 when the XRP coin price noted an escalation of more than 7% while trading above $0.22. Since then, the currency maintained its price above $0.22 with consolidation. Meanwhile, Bitcoin has also witnessed a price recovery above $7450.
Ripple Price Prediction:
Two days ago, Ripple started trading with its opening price at $0.2193 and took an initial upswing at $0.2239. The coin corrected down within a few hours and found support at $0.2138. Here, the XRP coin struck a remarkable price recovery and reached above $0.2295. It traced a pullback at $0.2258 before closing the day.
Yesterday, XRP coin kept consolidating for the whole day, except for a high spike up to $0.2298. Despite a downward correction before closing, the coin has remained above $0.22, proving its potential. Today, the currency has started forming bearish candles after a surge above $0.2267. At 04:46:48 UTC, Ripple price is trading at $0.2254, just below the Fib retracement level od 22.60%.

SMA lines are giving positive signs since yesterday as its short-term SMA line is above the long-term SMA line. The Bollinger Bands indicate to the current volatile phase while heading towards a shrink. The RSI of XRP coin is at 46, showing no extremities, while MACD is heading towards a bullish crossover.
Ripple price trend apparently holds resistance levels at $0.2290, $0.2335, and $0.2360 and support levels at $0.2220, $0.2195 and $0.2150. Notably, the coin is still carrying a selling pressure. Check out XRP Predictions by experts before investing in it to maximize your profit.


