- Ripple price is down by more than 3%; consolidates today
- The coin is trading below the 23.60% Fib level; recently formed bullish candles
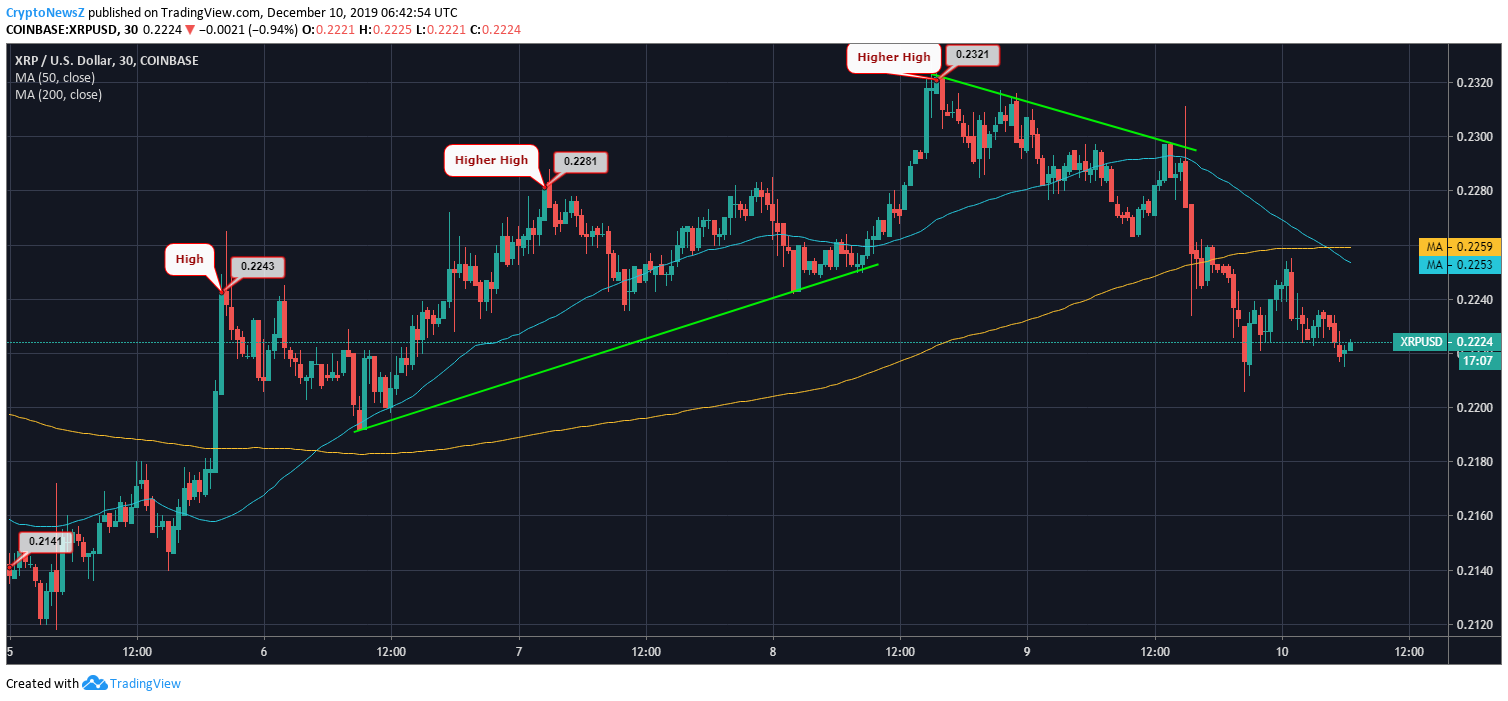
- The 5-day chart looks positive; however, the XRP coin has corrected down after the notable surge
- The coin has formed a bearish trendline over the last couple of days
Advertisement
Ripple is on a bearish spree for more than a month now due to quite an impactive market pressure. The coin’s sluggish nature has also played a vital role as the XRP coin seems range-bound below $0.25 since November’s last week.
Ripple Price Prediction
The 1-day price chart of Ripple cryptocurrency manifests a clear price decline from $0.23 to $0.22. After dropping by 3.73%, the XRP price has mildly rebounded, but it still lacks momentum. The coin is below the 23.60% Fib level and is likely to trade upwards. Today morning, Ripple to USD has managed to hit the price mark near the 50% Fib level.
1-Day Chart of Ripple

RSI is above 50, noting a stable phase for the coin. MACD chart is also set to enter the bullish zone with its MACD line on the upside. SMA lines show a bearish picture as the short-term SMA line is below the long-term SMA line.
5-Day Chart Coin
The 5-day Ripple price chart shows an initial uptrend, which has paused after it formed a bearish trendline. Five days ago, XRP coin opened at $0.21 and surged to form a high above $0.224. Ripple traced a higher high at $0.228 after a day-long price rise. The coin managed to trade as high as $0.23 before starting a pullback.
The pullback, along with a bearish trendline, has brought the coin back to the $0.22 price range. In the next one week, XRP coin is likely to see resistance at $0.2352, $0.245 and $0.2563 and support levels at $0.2141, $0.2028 and $0.193.


