- XRP drops to $0.19 trading price area—giving a new 52-week low
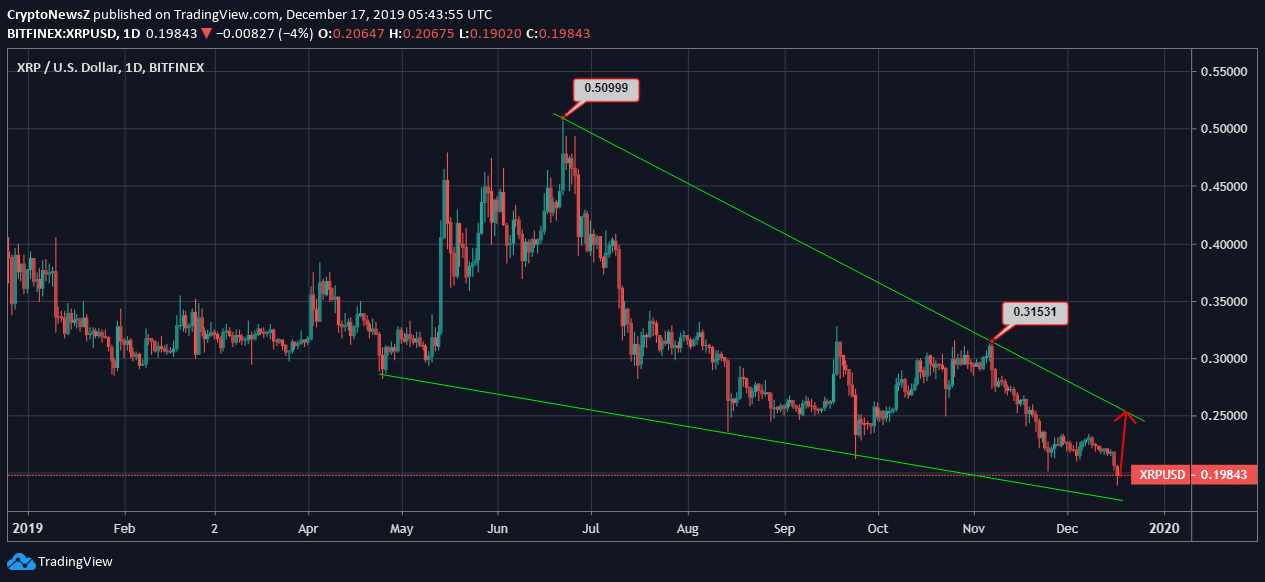
- The price of Ripple experiences a steep fall from the trading price of $0.509 and $0.315
- With the current fall, we see the narrowing of a trading range
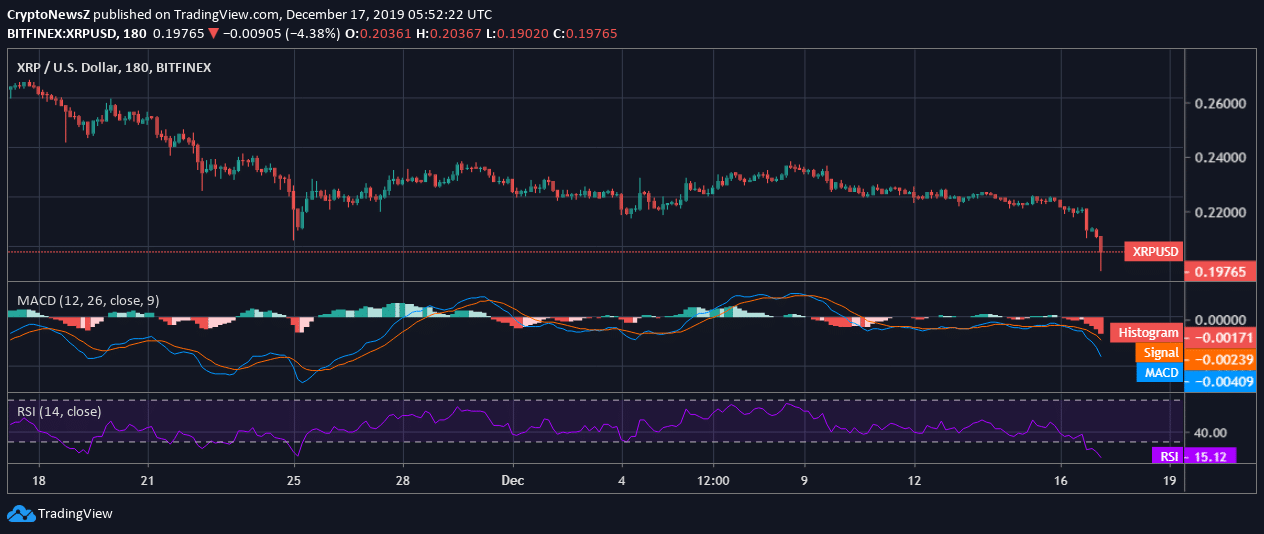
- The RSI of XRP coin falls below the ultimate support at 30 (oversold region) for the third time in a 30-day timeframe
Ripple price falls to the lowest of the year, giving a fresh 52-week low at $0.197. Just when Bitcoin price hit below $7,000, all the major coins, including Ethereum and XRP, have pulled back exponentially in the past 24 hours. However, the cumulative price movement of Ripple has been on a continual downswing and we observe a stable yet steep fall in the last month.
XRP News Today:
Advertisement
Looking into the 24-hour statistics of XRP/USD on Bitfinex, we also see that XRP price today has fallen notably over 8% from trading at $0.215 to currently trading at $0.197. Alongside the market cap and 24-hour trading volume has also witnessed a massive drop, and we believe that the bears are stronger than ever and even a moderate rise seems impossible.
Ripple Price Prediction:

Advertisement
Analyzing the year-to-date movement of Ripple, we see that the coin has been plunging after it soared as high as $0.509 in July this year. With each passing quarter and month, the trading price has been creating a narrow trading range, and as per that, further decline is possible.
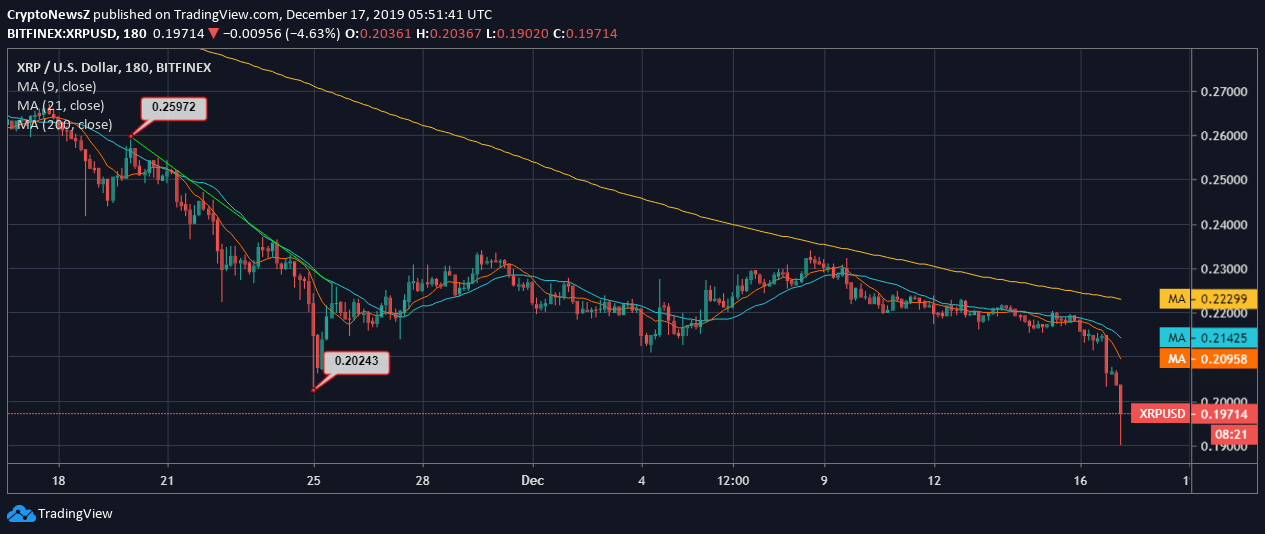
Taking a closer view of the month movement of XRP price, we see that the volatility remained quite stable for the major part of the month after the coin remarkably slid from $0.259 to $0.202. The recent decline below $0.20 inactive support has led the coin to trade at the lowest of the year at $0.197. Ripple currently trades utterly bearish with negligible support from 9-day, 21-day, and 200-day MA. The risky trading area for the coin began when it persistently slid below $0.21, losing the 21-day support, which is also seen down-trending now.
Technical Indicators:
As observed by the technical indicators that are laid on the chart, we see that the coin is trading below zero and holds a total bearish crossover as the coin breaches the support around $0.20.
The RSI of the coin is also below 30 and has hit the support point of the oversold region.


