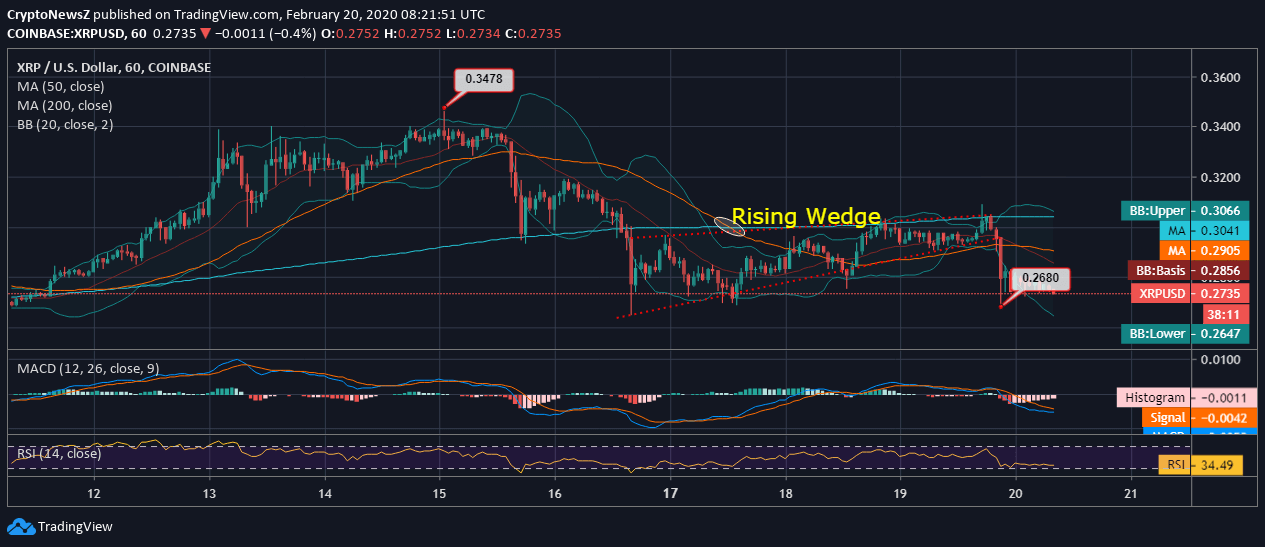
- Ripple pulls back after hitting a fresh 90-day high at $0.34 over the past five days and lacks support from the daily moving averages
- The rising wedge candlestick formation led to the price of XRP to test support around $0.268. XRP against USD trades with expanding volatility as the 20-day Bollinger Bands widen
- The bearish divergence takes place as the major coins of the market including BTC and ETH corrects downwards
- There happen to be multiple traces of downwards breakout as the trend hits below 20-day lower Bollinger Band
Advertisement
XRP exhibits slight positive intraday corrections as the coin trades at $0.273 from the daily bottom of $0.268. Bitcoin also dumps as it retests supports below $9,700 over the past 24 hours, and the market turns red.
XRP Price Analysis:

Analyzing the hourly XRP/USD movement on Coinbase, we see that the coin forms a rising wedge as it hits a daily bottom at $0.268. The persistent bullish trade of Ripple price above $0.30 loses the traction and turns bearish as there happened to be a “death crossover,” i.e., 200-day MA crossed above the daily 50-day MA. The rising trend that was observed since the start of the year takes a halt as the market pulls back again. This lays a varying impact on trading volume and a market cap of the coin as the selling pressure intensifies.
However, we can consider this as a usual correction as the market is deemed to rise after the “golden crossover” of Bitcoin, after which it has also retested resistance at $10,500. Therefore, the current consolidation is anticipated to be temporary. You can check out our Ripple Predictions by experts to know furthermore about Ripple’s future market.
Technicals:
The MACD of hourly Ripple price is showing a bearish divergence due to intraday pullback, and the signal line overrides the MACD line.
Similarly, the RSI of the coin is at 34.49 and is inclined towards the selling zone as the selling pressure intensifies and graces the short position holders.


