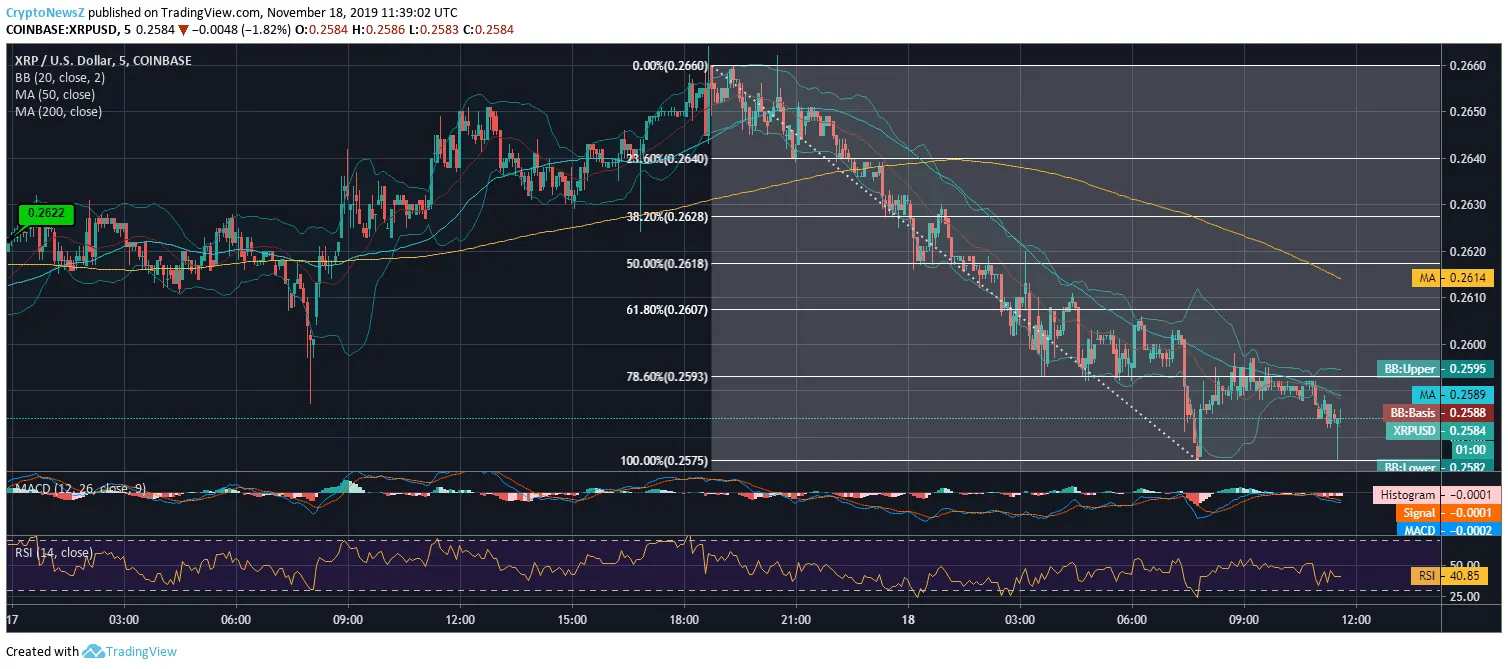
- Ripple has recently hit bottom at $0.2584; awaits a rebound above $0.27
- XRP has breached even below the Fib retracement level of 78.60% ($0.2593)
- The recent support level that the coin saw was at $0.2575 the Fib retracement level of 100%
- Technical Indicators appear all bearish; gets investors on an edge
Advertisement
Ripple has slipped under strong selling pressure today as it has broken below major support levels. The recent price drop has caused an S/R flip in its price trend as its support levels are now posing as upcoming price barriers.
Ripple Price Analysis:
XRP coin started trading yesterday with its opening price at $0.2622, and the coin traced a swing low at $0.2601 before rising to $0.2656. As XRP couldn’t clear the rejection above, it tumbled but stayed above $0.26 till the day closed.
Today, Ripple has started trading with a breach below its Fib retracement level of 50%, and the coin has kept dropping constantly. At 11:39:02 UTC, Ripple is trading at $0.2584.

If we look at the Bollinger bands, they have recently moved a wider apart from each other after a squeeze, which shows that the coin is witnessing a bit of volatility at this moment. However, the way the XRP coin is yet to rebound even above the Fib retracement level of 78.60%, it shows its extreme phase.
The short term SMA line of XRP is much below its long term SMA line, noting a negative sign. Meanwhile, the MACD chart is also in the bearish zone with its MACD line below the signal line. RSI is at 40, indicating that it may enter the oversold zone.
Ripple is likely to see resistance levels at $0.2723, $0.2752 if the coin succeeds to strike a bullish break out above $0.2687, and its support levels stand at $0.2622, $0.2593 and $0.2557. You can know about XRP current price anytime, just you need to go at our price page.


