This content has been archived. It may no longer be relevant.
- The 24-hour price movements of Ripple look bearish amid a few dips below $0.29.
- The monthly chart of XRP gives positive signs; noted an increase of more than 16%.
- Ripple has been facing major rejection above $30, price range around $28 to $26 seems to be posing as a support level.
- Technical indicators point to the upcoming bullish phase.
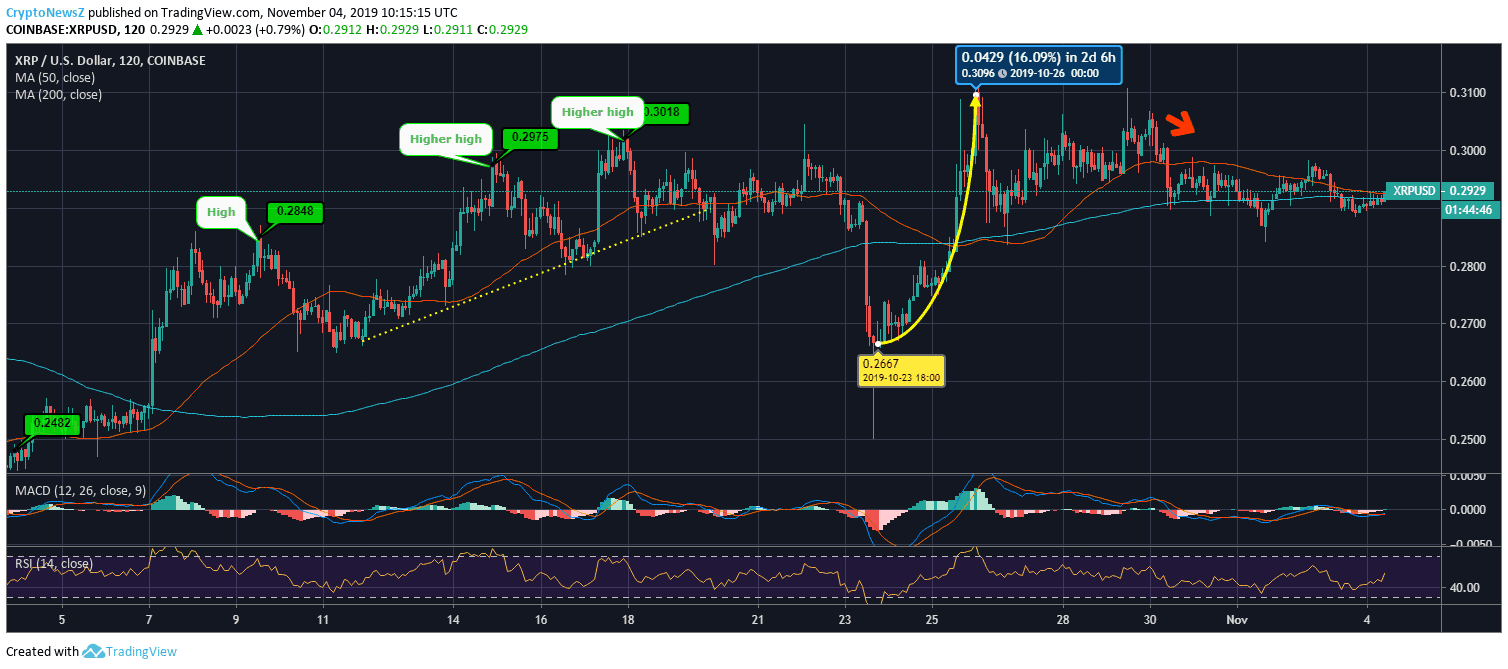
Ripple (XRP) has gone through an extremely bearish phase till mid-October except for a bullish price move above $0.31 in September. At the time, Ripple price was struggling to stay above $0.27 amid the over-all bearish crypto market. However, in the last one month, XRP price has recovered its price substantially.
Initially in October, Ripple was as down as $0.24 and was slowly tracing an uptrend. It managed to clear major resistance levels near $0.28, $0.29 and $0.30 tracing a higher-high pattern while giving a positive sign. The bullish trend line broke when it pulled-back near $0.26 breaching key supports. Seeing support here, the coin sharply rebounded above $0.30, mirroring Bitcoin’s bullish price move.
Advertisement
On the same day, XRP corrected down to $0.2930, and since then it has maintained its price range below $0.30. At 10:15:15 UTC, Ripple was trading at $0.2929.
XRP to USD Price Chart:

The long term SMA line (200-days) is below the short term SMA line (50-days) showing the current bullish momentum. XRP is currently trading with its price pretty much above its 50-day SMA of $0.2772 but, is below the 200-day SMA of $0.3243. However, the coin is still carrying the selling pressure.
Advertisement
Notably, the MACD chart is heading for a bullish cross-over, while RSI is just above 50, showing no extremities. If XRP breaks above $0.2959, price hurdles near $0.3007 and $0.3042 are to watch for. Also, a price drop below $0.2876 can take the coin to the support levels near $0.2841 and $0.2793.


