This content has been archived. It may no longer be relevant.
- Ripple resumes yesterday’s price recovery, but is still below $0.26
- XRP faces hurdles above $0.2580; bears to blame
- The 3-month chart appears depressive, esp. for investors, as XRP has seen a significant downward shift.
- The price level near $0.25 has been acting as strong support for Ripple since the last seven days.
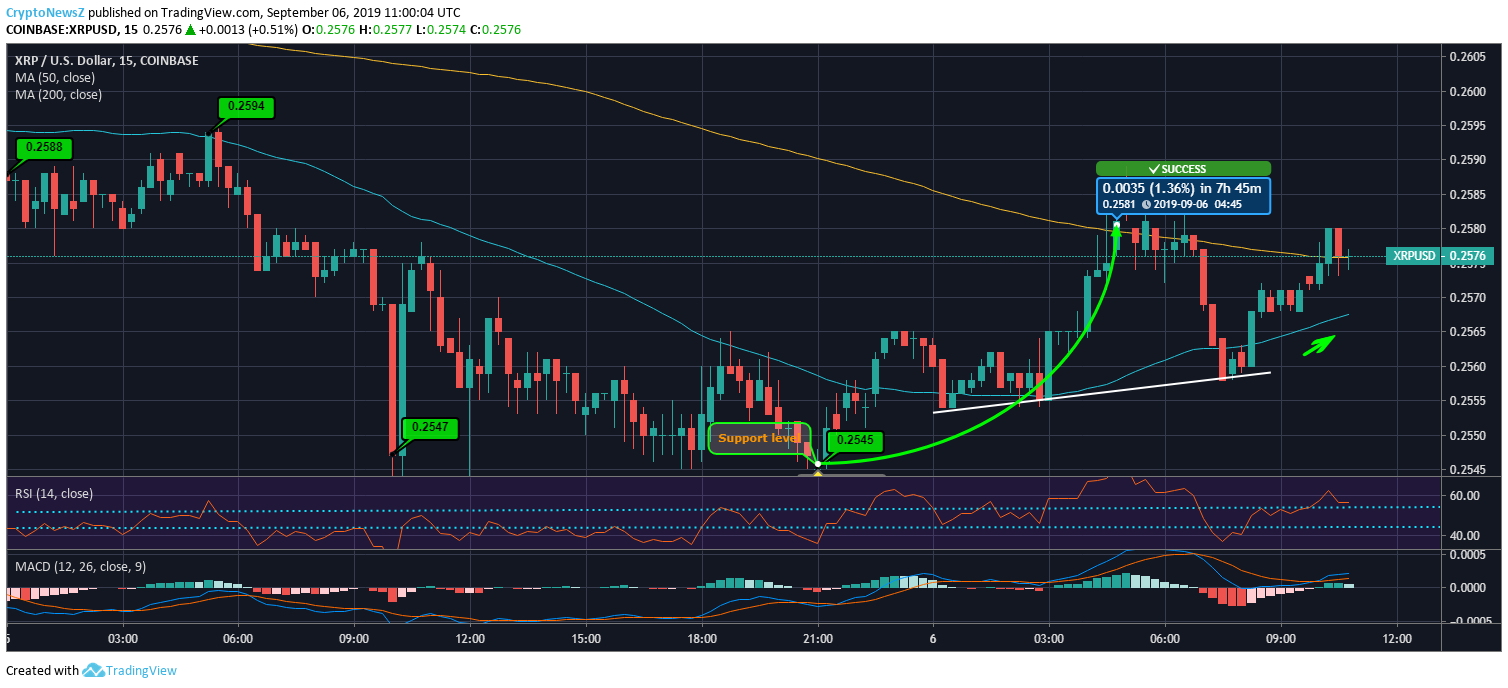
Ripple price was heading towards the crucial support level of $0.25 yesterday, but it started a rebound journey before closing on the day. From its low swing near $0.2545, the coin managed to reach near $0.2563.
Today, continuing the rebound, the coin has sustained an uptrend. Compared to yesterday’s low swing, XRP price has gained by more than 1% near $0.2581. Seeing a rejection there, Ripple saw a downward correction below $0.256 and then bounced up to $0.2576.
XRP/USD Intraday Price Chart

Advertisement
Considering an investor’s perspective, the 3-month chart paints a gloomy picture for Ripple. With a strong bearish trendline, the coin had fallen from above $0.47 to $0.29. After that, it has extended the sluggish trend and has broken below major support levels of $0.28 and $0.26.
Ripple 3-Month Price Chart
Technical Indicators of the intraday chart are gearing up for bullish zone, as the SMA lines are heading up for a bullish crossover. RSI is above the transition zone near 60. And MACD has just entered the bullish phase with MACD line above the signal line.
Advertisement
Ripple may face resistance at $0.2596, $0.2630 and $0.2654, while, its support levels can be at $ 0.2539, $0.2515, and $0.2482.


