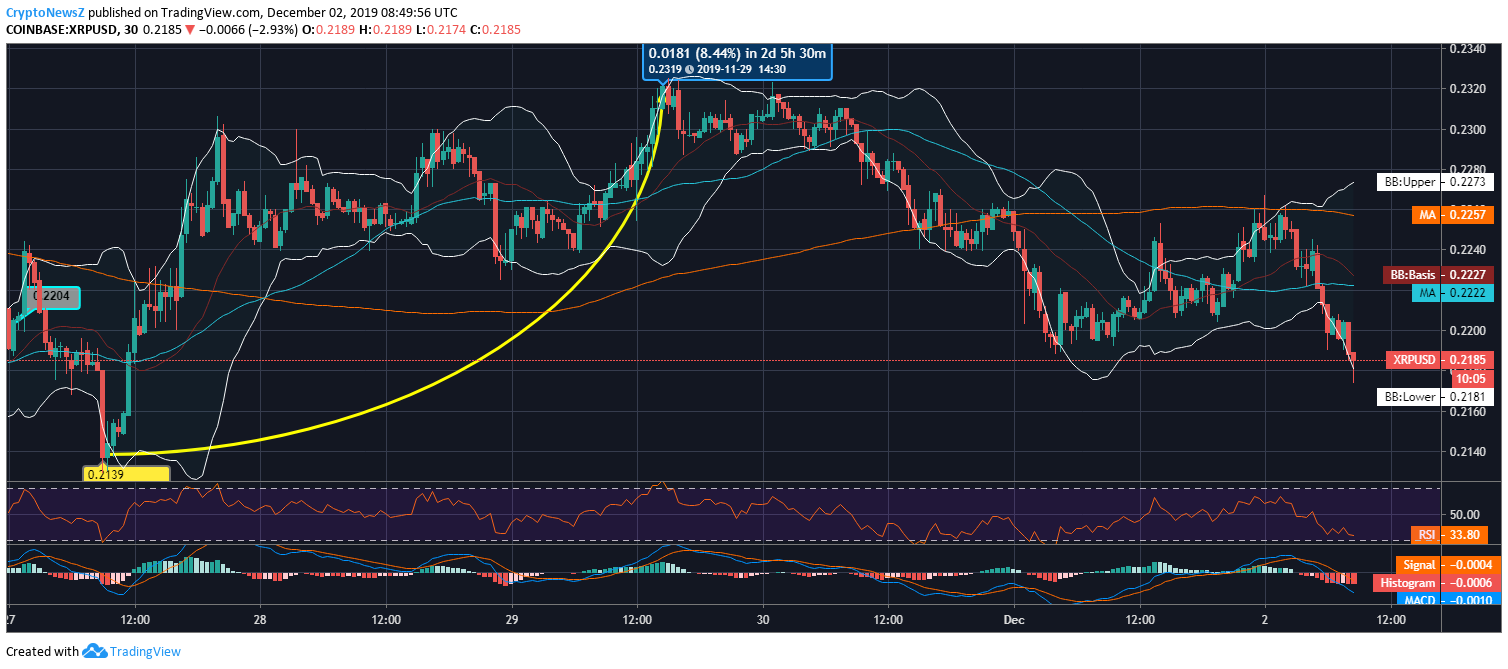
- Ripple price witnesses bear today; recently formed a bearish candle
- The coin struggles to remain above $0.22; support levels appear at $0.2191
- Technical indicators look bearish while the coin carries selling pressure
- XRP coin is heading towards volatility according to the Bollinger bands
Advertisement
The crypto market has been attempting to come out of the bearish grip; however, today, price drops are taking place. Major altcoin, Ripple, is correcting down today after surging above $0.23. Meanwhile, Bitcoin has started an uptrend after forming a dip at $7241.
Ripple Price Prediction:
On November 27, the XRP coin has started a bullish spree after dropping near $0.2139. The price rise ushered the coin above $0.2290 before closing the day. However, the Ripple saw a pullback at the time of closing. The coin kept consolidating for two days, and then it managed to climb above $0.23 with an increase of 8.44%.
The day before yesterday was bearish for the coin as it steadily tumbled for the whole day. Moreover, yesterday’s price escalation has seen a break today. At 08:49:56 UTC, Ripple to USD price is trading at $0.2185.

All the technical indicators are showing quite negative signs at present. The SMA lines have traced a death cross as the short-term SMA line has slipped below the long-term one. RSI about to touch 30, noting an oversold momentum of XRP coin. Bollinger bands have just opened wider, indicating upcoming volatility while the MACD chart is heading towards a negative bias.
Ripple is likely to see resistance at $0.2278, $0.2303, and $0.2341 and support levels at $0.2215, $0.2177 and $0.2152.


