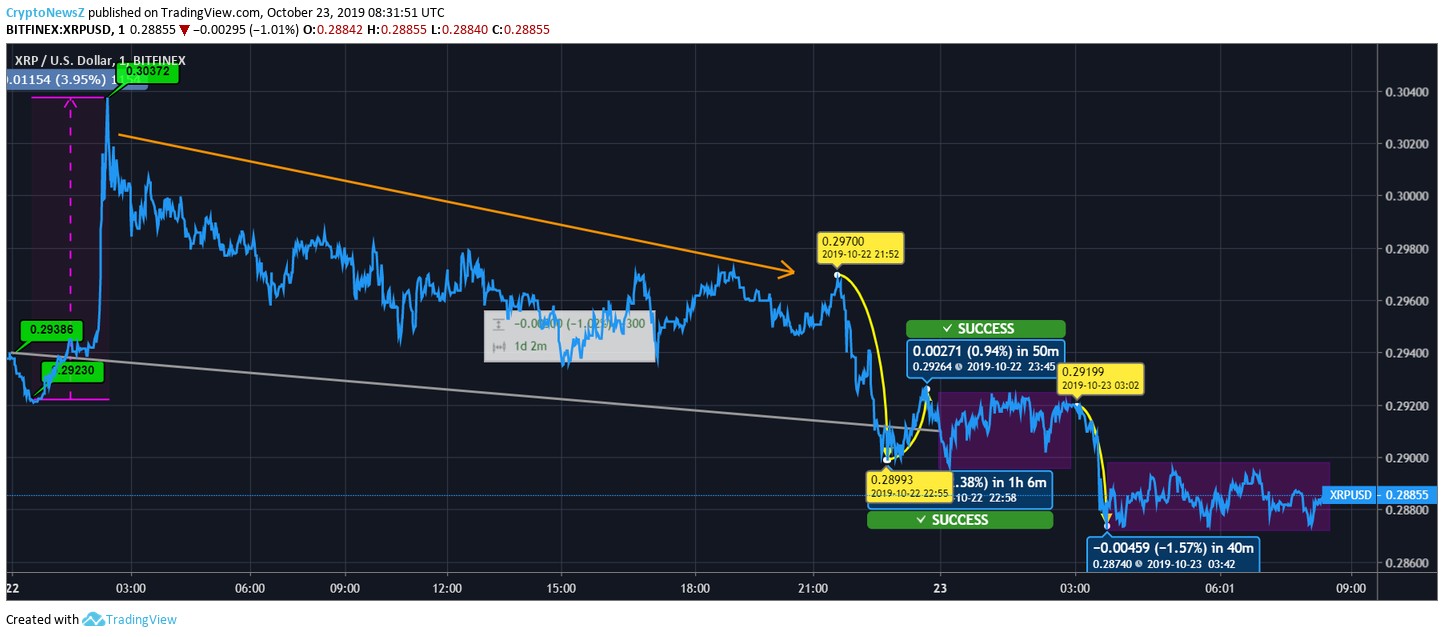
- Ripple (XRP) registers loss during the intraday movement
Advertisement
The market is reflecting the bearish trend since the beginning of the day. The big forces like Bitcoin, Ethereum were also drenched seen declining. Ripple, that was behaving distinctively was also red and is still in the same position. The coin is expected to have a pale closing.
Yesterday, XRP Price was seen touching a high at $0.301484 and a low at $0.291104 with a volume of $1,632,212,674. Now, let’s have a look at the intraday chart.
XRP to USD Price Analysis:
Yesterday, XRP started dealing at $0.293. The price marked improvement in the later hours and jumped from $0.292 to $0.303 by 3.95%. The coin started falling after touching $0.303. The major fall took place before closing that brought it down to $0.289 from $0.297 by 1.38%. The same improved and went up to $0.292 by 0.94%. The intraday price movement brought a regression of 1.02% as it closed at $0.291.
Today, Ripple began the day trading at $0.292 and kept moving around it for some time. The coin fell to $0.287 from $0.291 by 1.57% while the coin is now keeping it tight around $0.288.

XRP is counted amongst the top ten cryptocurrencies that give maximum results to the traders. The coin was recently seen mounting despite the fluctuating market. The calculated resistance and support levels for the current XRP price are as follows:
| Resistance Level | Price | Support Level | Price |
| R1 | $0.298359 | S3 | $0.287979 |
| R2 | $0.305112 | S2 | $0.284352 |
| R3 | $0.308739 | S1 | $0.277599 |
As we can see in the above-mentioned chart, the price is almost near the immediate support level. The price seems to be violating the next support level at $0.284. Altogether, intraday trading wouldn’t bring positive results to the traders. However, the coin is expected to improve in the future. The traders are recommended to opt for long-term investment for booking a colossal profit. Check out our forecast page to read more about Ripple price prediction.


