This content has been archived. It may no longer be relevant.
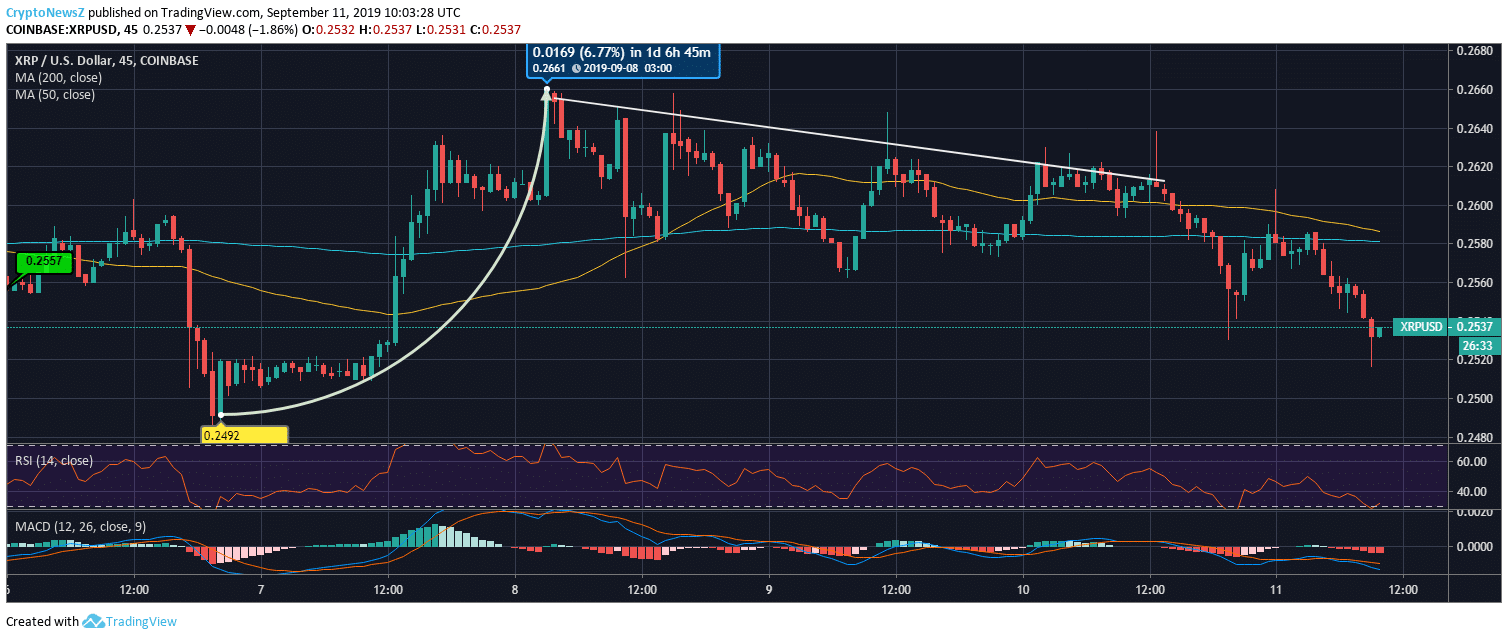
It is today when Ripple has returned to $0.25 price range after having a 3-day long mild bullish phase. XRP had been ranging between $0.26 to $0.2567 till yesterday while tracing multiple ups and downs. Today, the coin has started trading well below $0.26 and is still heading downwards.
The coin was hovering around $0.2557 on September 6, and today, after a bullish spree, XRP has traded even below $0.2540. Ripple price had formed a dip near $0.2492 before taking a high spike above $0.26.
Advertisement
With an increase of 6.77%, the coin had managed to hit the $0.2661 price mark. Since then, it is struggling to remain steadily above $0.26 as it has traced a long lower high pattern with a bearish trendline. However, XRP has recently formed a rebounding candle at $0.2537 at UTC 10:03:28.
XRP/USD Price Chart

Technical indicators are showing a bearish picture at the moment except for the SMA lines. The short term SMA line is above the long term SMA line, which does indicate a positive sign, but they are slowly heading for a crossover.
Ripple Technical Indicators
Advertisement
RSI is near 30, indicating an oversold phase. While MACD chart is in a bearish zone with its MACD line below the signal line. Ripple may face resistance at $0.2628, $0.2669 and $0.2703, and can see support levels at $0.2553, $0.2519, and $0.2478.


