This content has been archived. It may no longer be relevant.
- Ripple has recently started to move upwards, but is still below $0.30
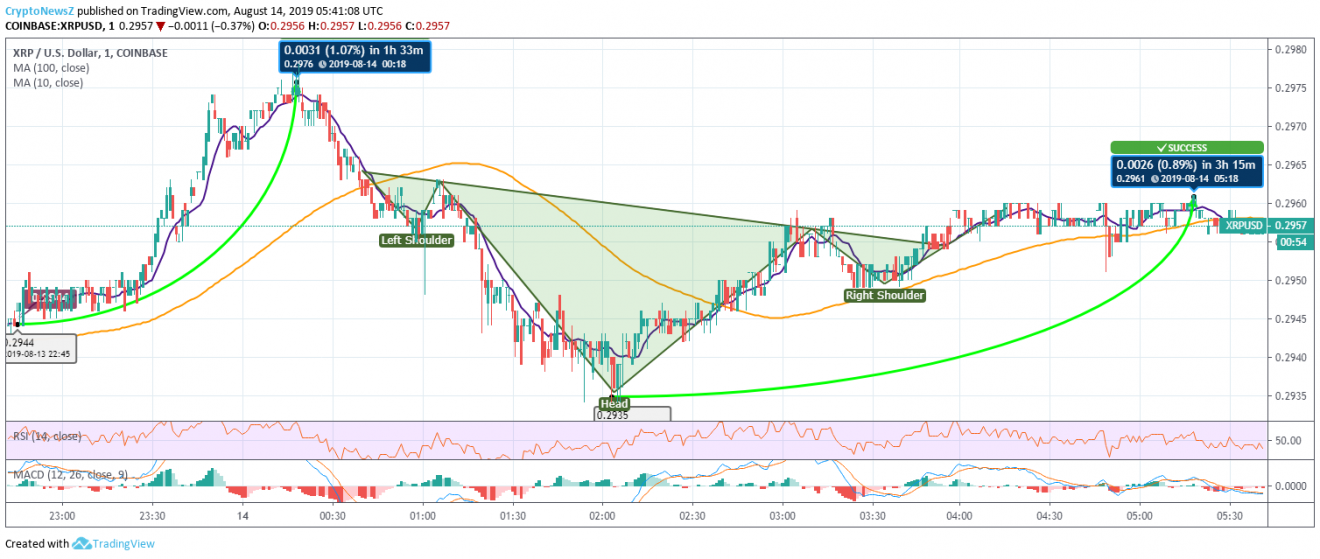
- The 7-hourly chart of XRP has traced an Inverse Head and Shoulder pattern, which indicates an upcoming uptrend
- The Ripple price has recently found support near $0.2935 and rebounded from there
- XRP is mildly bullish after the rebound and is carrying a selling pressure
Ripple price has recently shown a mild bullish bias in its price trend after it saw a price plunge near $0.2935. Although the coin is struggling to maintain an uptrend against U.S.Dollar, as the coin is facing hurdles to steadily climb above $0.30.
Yesterday, under a bearish impact, Ripple coin saw a drop from $0.3000 to $0.2915 and bounced back. Despite the rebound, XRP couldn’t trade above $0.30. According to the given 7-hour chart, XRP was at $0.2944 at 22:45 UTC yesterday and it escalated from there with an increase of 1.07%. Here, the price of Ripple reached as high as $0.2976 and then corrected down.
Advertisement
Extending the downtrend today, Ripple price has hit the bottom at $0.2935 after breaking support near $0.2960. The coin rebounded above $0.295 and again took a small dip near $0.2949. Here, XRP price has traced an inverse head and shoulder pattern which points out to the uptrend. Ripple was trading at $0.2957 at 05:41:08 UTC.
XRP/USD Price Chart by TradingView

Ripple’s current price is 20.36% lower than its 100-day SMA of $0.3713. Also the coin is below its 5-day SMA. In the chart, the short-term SMA (10-Day) is about to move below the long term SMA (100-Day), which indicates a price fall.
XRP seems to have a support at $0.2935. Now when the coin is above $0.295 it may see immediate support level at $0.2945. The XRP price, at present, is battling with price barriers to trade above $0.30. To know the coin’s future performance, you can learn more about the future price prediction of Ripple for upcoming years by clicking here.
Ripple Price Prediction & Technical Indicators:
Advertisement
MACD chart of XRP/USD is in the bearish zone with its MACD line below the Signal line. RSI for the coin is just below 50 showing no extremities. Ripple may face resistance at $0.3006 and $0.3047 and support at $0.293 and $0.2895.


