This content has been archived. It may no longer be relevant.
- The 5-day chart of Ripple coin shows steady price rise, except for a short term bearishness on 18th June
- XRP price trend is currently tracing an upward momentum having strong support level at $0.4300
- Ripple has surged to 7.86% over the last 5 days
- XRP may see rapid gains if it clears the price barriers near $0.4400
Since yesterday, XRP price has been heading upwards holding the price position above $0.4300. Ripple coin is on the way of its price recovery after it saw a gradual price plunge on 18th June, causing it to form a swing low near $0.4175 breaking a critical support level at $0.4200.
The ripple price, however, corrected upwards and it had its closing price at $0.4288 on the same day. And yesterday, XRP has soared to the price level above $0.4300. The steady uptrend in XRP seems to be due to its announcement regarding the partnership between Ripple and MoneyGram, which is expected to propel the XRP prices further.
XRP/USD 5 Day Price Chart by TradingView:

Advertisement
As we can see from ripple price chart over a time span of 5 days, XRP has seen a remarkable price growth where the price had its opening price at $0.4058 on 15th June after which it ended the week with its closing price at $0.4275, hitting a price level as high as $0.4415.
With a sharp price spike, XRP again surged to its 30 Day High price mark at $0.4636 with an increase of 7.82%. After that, the coin tumbled, tracing a bearish trend line where it tested its major support level of $0.4183, and then corrected upwards.
After hovering a bit between $0.42 and $0.43, XRP appears stable above $0.43 at present. At 04:30:45 UTC, Ripple was trading at $0.4349, which is higher than its last 15-days SMA of $0.4134. Also, the 15-days SMA is 16.97% higher than the 100-days SMA of $0.3534, thanks to the recent bull run in XRP price.
Advertisement
With that, Crypto analysts believe that a price drop below $0.4200 can invite an extended price fall.
Technical Indicators
- MACD for XRP/USD currently appears bearish, lacking price fluctuations. Also, the MACD line moves below the signal line indicating a downward shift in its price.
- RSI for XRP/USD appears near 50, indicating stability in the price trend of Ripple.
- Major Resistance levels for Ripple: R1=$0.441; R2=$0.4454
- Major Support levels for Ripple: S1=$0.4293; S2=$0.422
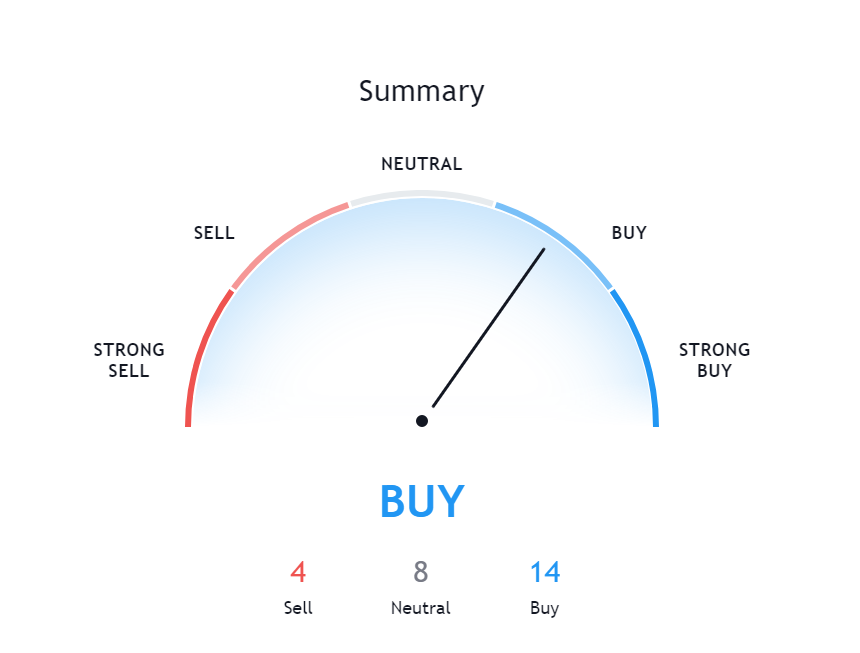
- The technical indicator that shows current momentum hints at the ‘BUY’ mode looking at the XRP price performance over a week. Though, it indicates to ‘Strong Buy’ momentum for the last 1 day.


