This content has been archived. It may no longer be relevant.
- XRP price again struggling to stay above $0.40
- Price level above $0.39 acts as a strong support level
- RSI for Ripple is at 43, shows no extremities
- MACD for XRP/UST appears moderately volatile
After yesterday’s price turbulence, today XRP had started to move upwards and it maintained its price above $0.40 for some hours. But recently, the coin has started to wave between $0.39 to $0.40, however, the support level of $0.38 is intact.
On the other hand, Bitcoin price has been maintaining its price above $11000 since today morning, showing a bullish trend in the market.
Current Statistics:
Advertisement
At 11:07:22 UTC, XRP was trading at $0.3995. The coin has 42,566,596,173 XRP as part of its Circulating Supply. It holds a Market Capitalization of $17,065,387,541. XRP fetches RoI (Return of Investment) of 6,725.35%.
XRP 4-Hour Price Chart
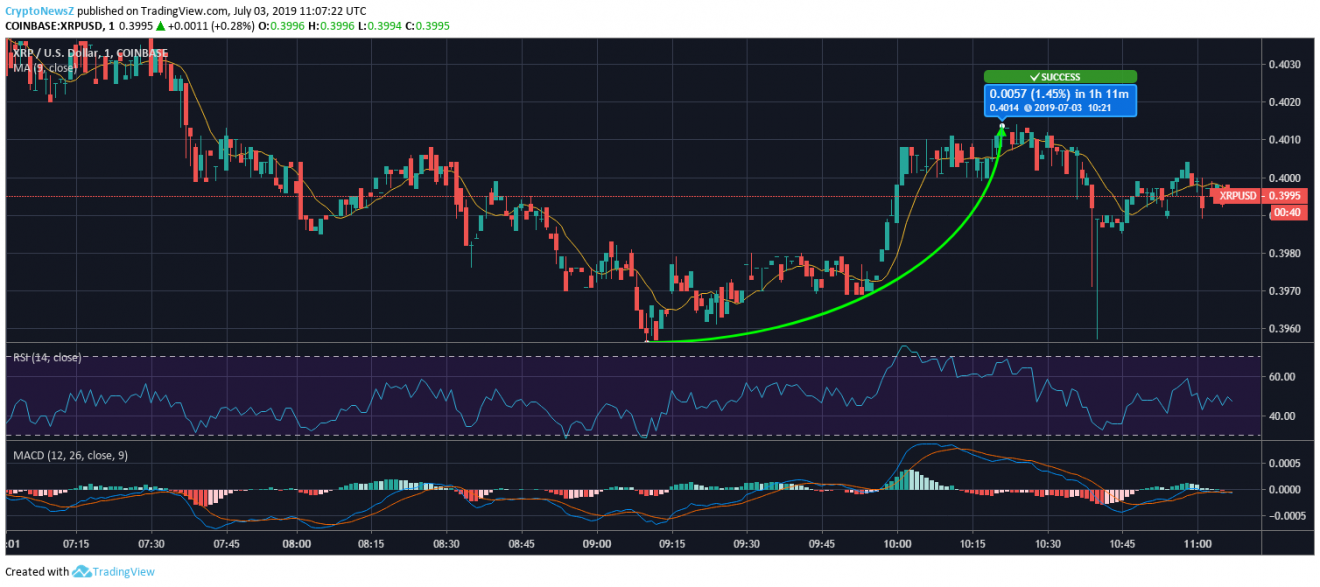
Over the last 4 hours, XRP has gradually decreased to $0.3956 from its price above $0.40. The coin has corrected from there but lacks the stability as it has failed to remain above $0.40. In the mentioned time span, the price has seen a decline of 1.04%.
The current price of XRP notably lags behind its 10 days SMA of $0.4243 by 6.76%, which shows that XRP is currently carrying quite a bearish nature.
Ripple Technical Indicators and Prediction:
Advertisement
RSI for XRP appears at 43 which shows no extremities at this point of time. While MACD for XRP seems moderately volatile with a bearish crossover. XRP may see major resistance levels at $0.4118 and $0.4234 if it takes a surge, while it may see support levels at $0.3865 and $0.3728.


