This content has been archived. It may no longer be relevant.
XRP once crossed 0.50 USD in the Bull Run, when BTC went beyond 13,800. But none of the said coins remained persistent in their efforts to rise. This impacted XRP in a way that it even went below its major support level; however, the coin did try to bounce back but couldn’t really rise above 0.46 USD, the highest recorded price of the week. Currently, the price hovers around 0.40 USD.
On the contrary, Bitcoin went beyond 12,000 USD in the past 24 hours, indicating another Bull Run, and this time to trade continually to breach its previous records.
XRP Current Market Statistics:
- XRP currently trades at 0.40017 USD
- The market capitalization of the coin is 17,080,975,433 USD
- The current Circulating Supply and the 24h volume are 42,566,596,173 XRP and 1,317,034,191 USD
- XRP with the said trading price fetches 6,736.75% Return on Investment
XRP Chart:

XRP to USD Price Comparison:
Advertisement
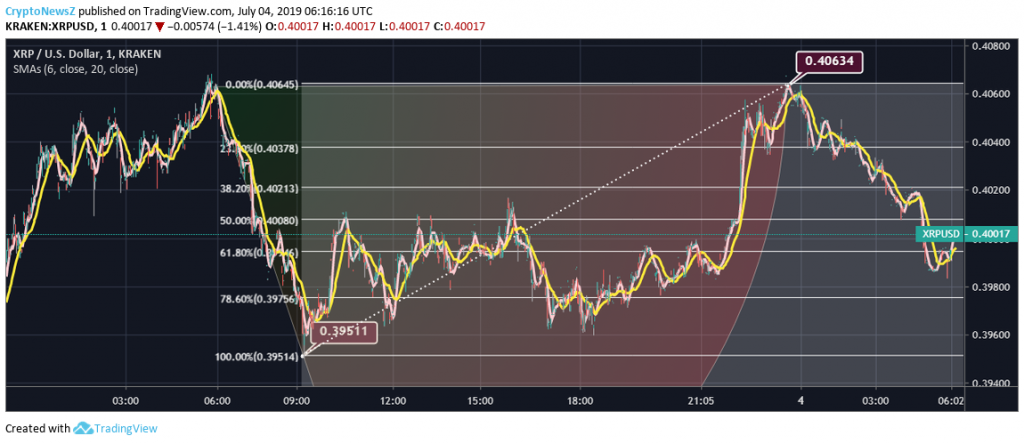
As per the above 1-day chart from Kraken, XRP currently trades at 0.40017 USD at 6:16 UTC as on 4th July. As observant from the chart, XRP had a steep rise in the price trend until 6:00 UTC. Later, it started falling and fell exorbitantly to trade around its major support level of 0.39 USD. Subsequently, it moved with a few dips. Around 21:05 UTC, the price gained momentum and rose above its support level to trade around 0.40, showing a growth of 2.84% even before the start of the next day. Facing a major resistance at the said price, the coin keeps rising and falling in the same range only.
Technical Indicators:
As the price moves beyond its major support levels, the 6-day SMA also crosses the 20-day SMA. But as seen with the daybreak today, the 20-day SMA moves beyond the 6-day SMA, as the price fell from 0.40634 USD to 0.40017 USD.
The Fibo retracement points out the major resistance levels and support levels for the current trading price. The immediate resistance level is 0.40080 USD, and similarly, the support level for the decline in the current price remains 0.39756 USD.
XRP Price Prediction and Conclusion:
Advertisement
XRP has enough potential to trade around 0.75 USD, only after it moves beyond 0.50 USD to trade persistently. Presently, the range within which it is trading needs to be breached to attain new price heights.


