This content has been archived. It may no longer be relevant.
- Ripple price again falls in the target range of bears, approaches $0.31
- XRP even saw a dip near $0.3080, found support there for now
- Ripple is currently correcting up, though is still below its 5-day SMA
Ripple price has recently tapped on a bit bearish bias against U.S.Dollar after yesterday’s surge above $0.32. Notably, yesterday, Bitcoin price traced a bullish up-swing when it went above $12k and corrected down from there to $11812.59. At present, BTC is near $11,626.43.
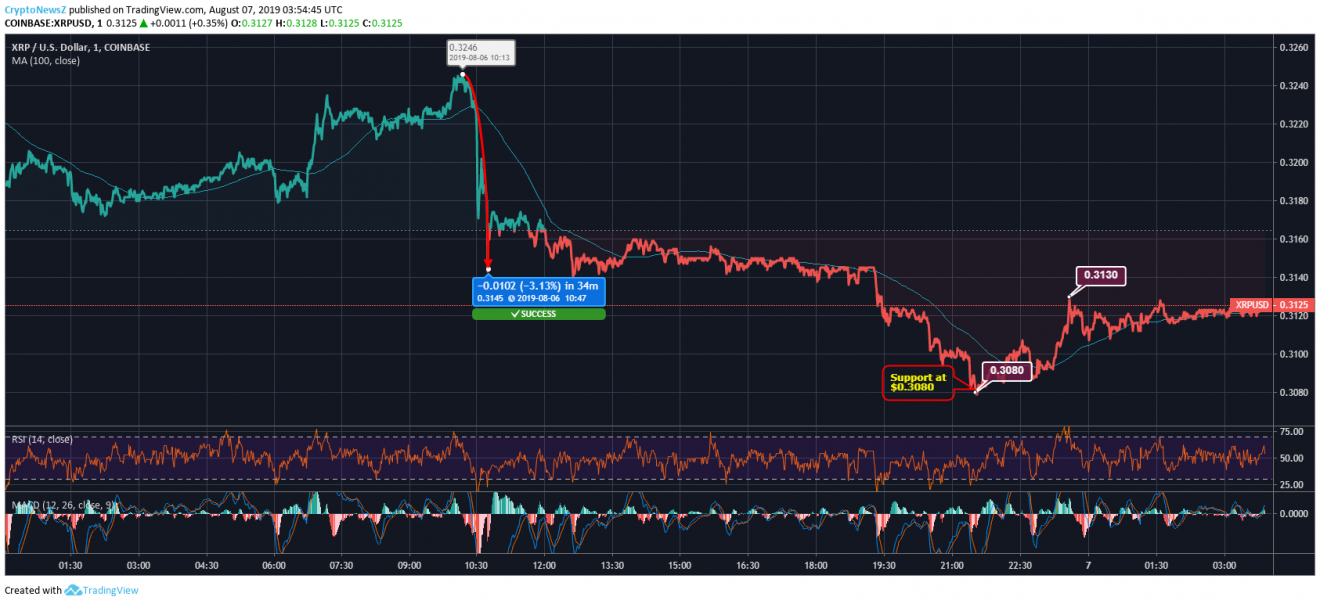
Till 10:12 UTC yesterday, XRP coin was trading while maintaining a bullish impact. The price of Ripple went as high as $0.3246 and sharply dropped from there to $0.3145 with a decrease of 3.13%. XRP, since then has been tracing a steady price fall causing it to break even below $0.31 near $0.3080.
Advertisement
Here, the Ripple coin seems to have found support to strike a price recovery and the Ripple price has corrected from there above $0.3130. Though the Ripple price is a bit down from there near $0.3125 at 03:54:45 UTC. In the last few hours, XRP coin has traced a swing low near $0.3080.
XRP/USD Price Chart by TradingView

XRP’s current price is 15.83% lower than its 100-day SMA of $0.3713 indicating to the current bearish price trend of the coin. Also, the recent price drop has pulled the price even below its 5-day SMA of $0.3157.
It seems that XRP has decent price support levels near $0.30 and $0.29. However, till yesterday, XRP was stably above $0.32 and today the mentioned price level poses as a resistance level.
Ripple Price Prediction & Technical Indicator:
Advertisement
MACD for XRP/USD is in bullish zone and is quite volatile at present. RSI for the Ripple coin is just above 50 indicating stability. XRP may see further resistance at $0.3212 and support level at $0.3051.


