This content has been archived. It may no longer be relevant.
-
- Ripple’s price recovery faces hurdles; dips below $0.4300
- The XRP bull run propelled by Bitcoin weekend rally seems to be at rest
- XRP needs to drift above $0.4300 to surge further
- A drop below $0.42 can invite an extended price fall
Since the last weekend, XRP was surging with leaps and bounds till today. The crypto Bull Run that caused XRP to jump above $0.4600 was partly backed by the Bitcoin price rally on the weekend along with Ripple’s collaboration with Moneygram.
Advertisement
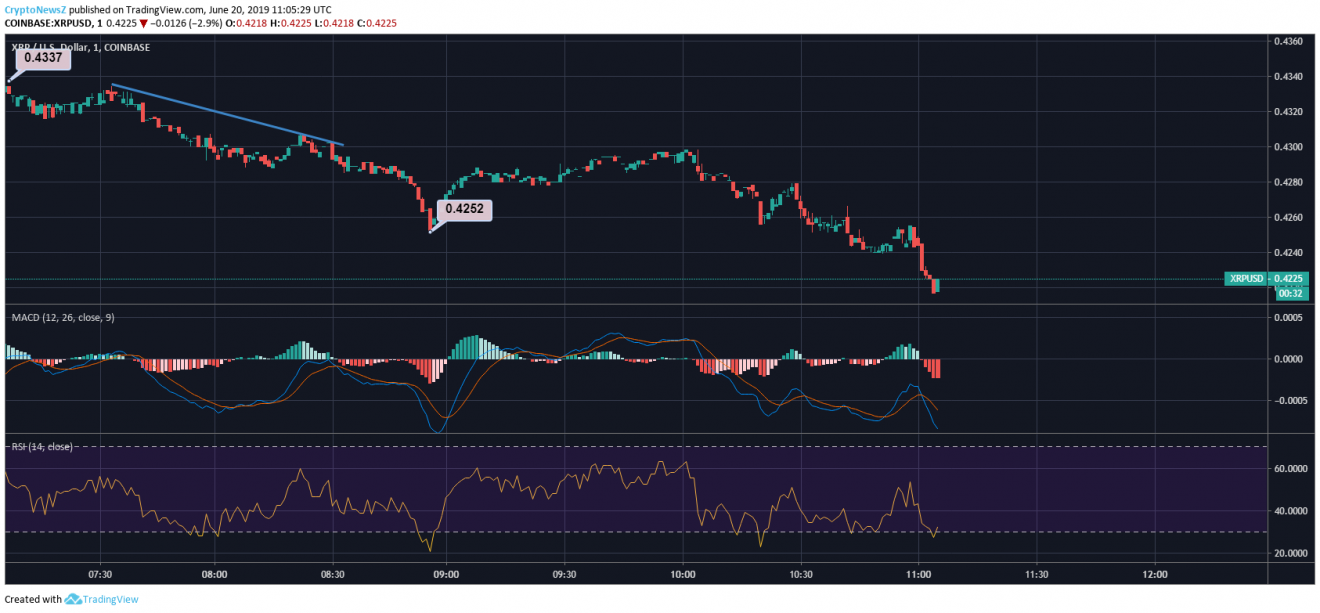
However, after initiating a strong price recovery from $0.41 on 18th June, the XRP price trend has started to decline in the last few hours. At 10:07:00 UTC, Ripple price was trading at $0.4225, close to its major support price. Currently, XRP is 3.27% lower than yesterday’s closing price at 0.4368.
XRP/USD 4 Hour Chart by TradingView:
Advertisement
The trend line in the 4-hour XRP chart indicates the bearishness. Initially, XRP was trading above $0.4300 which then dropped to $0.4252 breaking support at $0.4288 and 0.4286. XRP price trend has corrected upwards but is yet to break through the strong resistance level near $0.4300. In the last 4 hours, XRP has decreased by 2.58%.
Technical Indicator:
- MACD for XRP/USD points out to the current bearish phase in the price trend, as the MACD line moves below the Signal line.
- RSI for XRP/USD is below 30, indicating oversold or undervalued momentum for Ripple.
- Looking at the tumbling price of XRP, the technical indicator for a 4-hour time span signals ‘SELL’ for XRP.
- Major Resistance levels for XRP: R1=$0.441; R2=$0.4454
- Major Support levels for XRP: S1=$0.4100


