This content has been archived. It may no longer be relevant.
- Ripple finally managed to break the 0.40 USD price
- XRP Currently struggling to cross 0.40 USD (Again)
- RSI for XRP/USD is heading towards 70
- XRP price trend shows a bit of price fluctuation
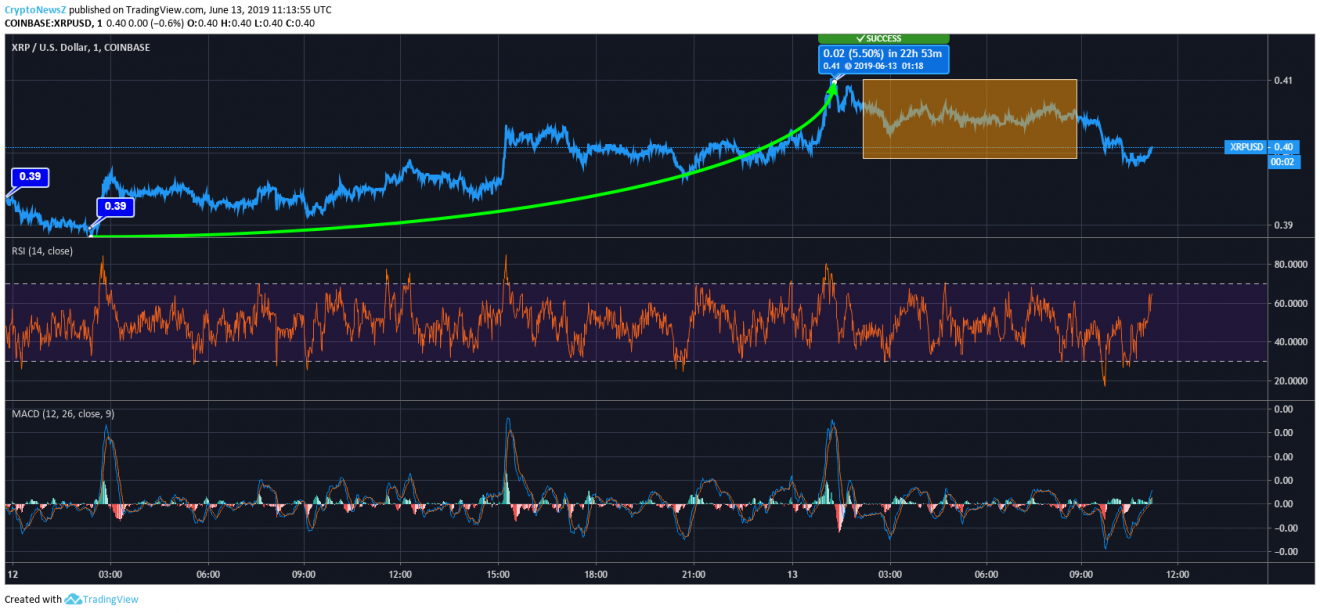
The whole crypto market had finally witnessed how Ripple crossed 0.40 USD and reached 0.41 USD price mark today. After that, the XRP price kept oscillating between 0.41 USD to 0.40 USD. Now, the third largest cryptocurrency, XRP is again facing bears as it is again struggling to break the 0.40 USD price barrier.
Ripple Price Current Statistics:
Advertisement
At 11:23:57 UTC, XRP was trading at 0.40 USD. XRP holds 17,084,468,815 USD as its Market Capitalization while having Circulating Supply of 42,501,950,124 XRP. Ripple fetches Return on Investment (RoI) of 6,743.38%.
XRP/USD Daily Chart:
Comparison:
Yesterday, XRP was trading at 0.39 USD having a bearish impact in its price trend. Today, it increased gradually and reached as high as 0.41 USD with a surge of 5.50%. Notably, XRP was failing to reach there since a couple of days. After maintaining its price at 0.41 USD, XRP started hovering between 0.40 USD and 0.41 USD, as shown in the highlighted part. In the last 24 hours, the crypto-coin has increased by 2.56%.
Technical Indicators:
- RSI for XRP/USD is heading towards 70, showing overbought momentum for Ripple
- MACD currently indicates slight volatility in its price trend, with a bit of price fluctuation, where currently, MACD line is moving above the signal line which indicates that the trend is changing.
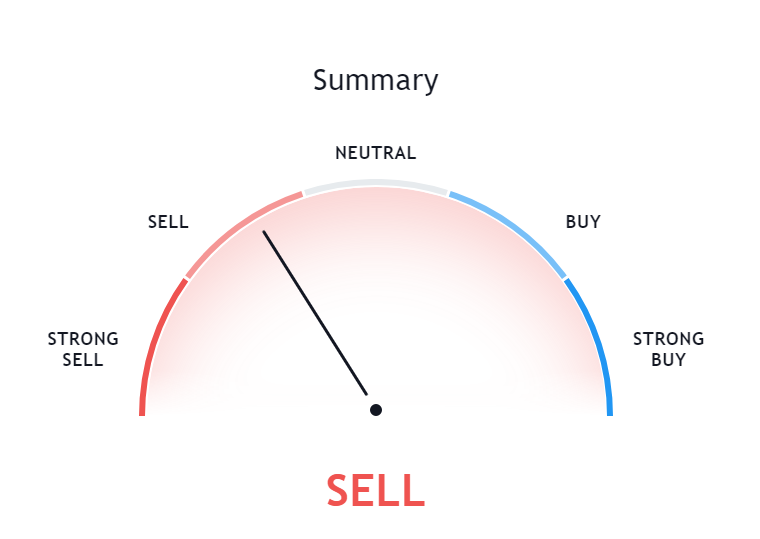
- The technical indicator for XRP is showing 1-day momentum which is indicating towards the “SELL” option for the investment in XRP
Conclusion:
Advertisement
Looking at its chart, it seems that XRP is likely to go for short term bullishness. If the XRP price goes upwards, it is anticipated to see resistance at 0.406 USD and 0.411 USD. However, if Ripple heads downward then it will see support levels at 0.39 USD and 0.38 USD.


