This content has been archived. It may no longer be relevant.
- Ripple has recently hit its 52-weeks low price point over the last 5-days
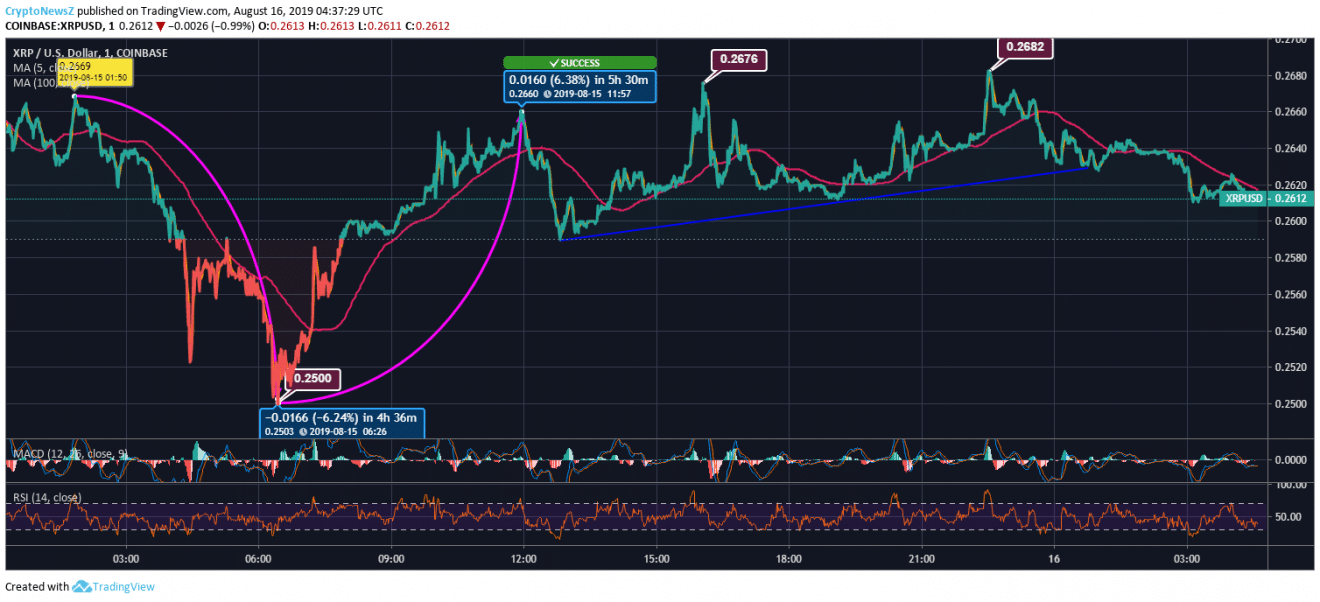
- XRP price sharply fell even below $0.25 on 14th August, and yesterday it again took a drop after correcting up
- The coin is currently struggling to stay above $0.26, has formed a bullish trendline above $0.259
- XRP is correcting down from $0.2682, may see support above $0.259
Yesterday, XRP’s bearish spree took a pause at $0.2500 against U.S.Dollar. The coin has shown an increase after that, but, it is extremely bearish considering its price scenario of the last few months.
Yesterday, XRP opened at $0.2637 and it escalated to $0.2669 after that. Later, the coin saw bottom at $0.25 and bounced back to $0.2660 with an increase of 6.38%, and then corrected down. Here, the coin started a bullish trendline. The coin has traced two major price spikes near $0.2676 and $0.2682.
Advertisement
Ripple is correcting down at the moment and is at $0.2612 at 04:34:29 UTC.
XRP/USD Price Chart

XRP is 29.46% lower than its 100 day SMA of $0.3703. Also, its long term SMA (100-day) is above its short term SMA (5-day) which indicates its bearish nature. While MACD is also in the bearish zone.
Ripple Price Prediction & Technical Indicators:
Advertisement
Ripple’s MACD chart is lowly volatile and is in the bearish zone, while it just had a bullish crossover. Its RSI indicator shows an oversold momentum. The coin may see resistance at $0.2751 and support at $0.2579.


