This content has been archived. It may no longer be relevant.
XRP may finally get back from its long slumber of a downtrend, as it touched the weekly critical support from where we saw its meteoric rise in the previous bull market.
XRP Price Analysis:
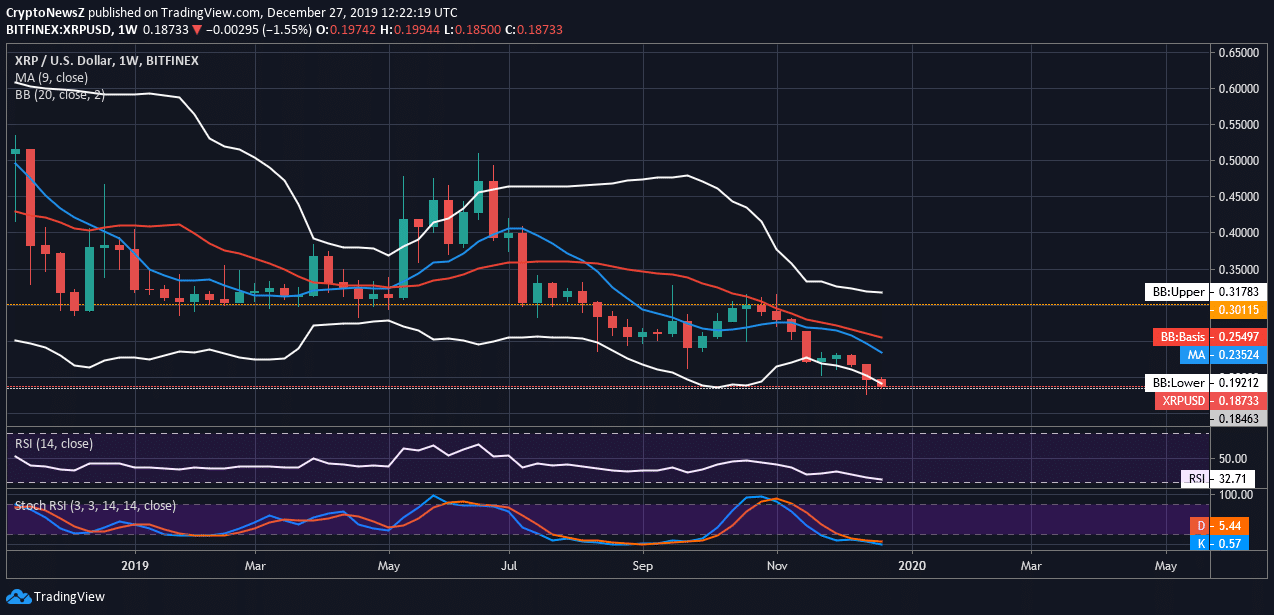
Weekly prices couldn’t do S/R (Support/Resistance) flip of the key level at $0.30 around Oct 2019 as denoted by the orange line in the below-given chart, and now it’s supported by the critical support at $0.187. Prices are at the lower Bollinger Band and it will try to return to the mean average at $0.254 represented by the red curve. RSI is at 32.71 which is skewed towards the oversold area and Stoch RSI is indicating that the prices are oversold, momentum may shift and XRP might see a price reversal. XRP might see a surge in price till $0.254 to $0.30; if it is successful in the S/R (Support/Resistance) flip of $0.30, XRP will see a new trend.

Advertisement
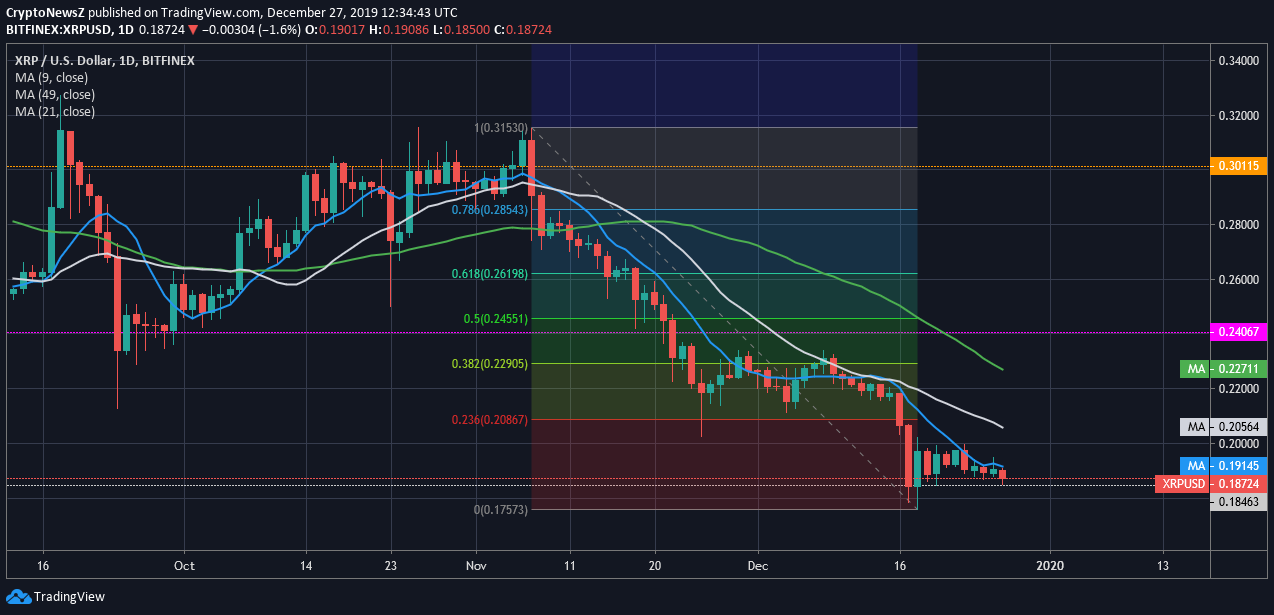
Daily XRP prices have found support at a weekly critical support level, currently trading under 9 days SMA (Simple Moving Average), 21 days SMA, and 49 days SMA represented by the blue line, white line and green line respectively in the below-given chart. Falling XRP prices respected the Fibonacci levels so far, especially 38.2% and 23.6% Fib level as shown in the below chart. Since prices are supported by the weekly critical support and weekly RSI (Relative Strength Index) and Stoch RSI (Stochastic Relative Strength Index) are oversold. XRP prices may bounce and TP (Take Profit) area can be taken as per the Fib level of 23.6% at $0.208 and 38.2% at $0.229 respectively. Meanwhile, 23.6% Fib level coincides with the 21 days SMA and 38.2% Fib level coincides with the 49 days SMA respectively. Daily RSI (Relative Strength Index) is at 34.24, skewed towards the oversold area.
Laying Ichimoku Kinko Hyo over the same 1D chart Time Frame for further insights as follow:
- Prices are under the Kumo; overall bearish outlook.
- Prices are under the Tenkan Sen (blue line) and Kijun Sen (red line); bearish.
- Chikou Span is also under the Kumo and price candles, bearish.
- Since prices are supported by the weekly critical support, Ripple Value may bounce from here towards $0.22 to $0.24, which was previous support.
Conclusion:
Advertisement
There is an opportunity for the day traders as XRP may see a short-term bounce towards its previous support, but for the complete reversal, it needs to do S/R (Support/Resistance) flip of $0.30 level. If it fails to hold this weekly critical support at $0.18, XRP may be in a downward price discovery mode for the support area.


