Ripple’s prices against the USD are right at the weekly critical support, and Bulls are defending this position strongly. There is a triple bottom formation at the daily charts, and it may be a good time to go long from here for the long-term investment.
XRP Price Prediction:
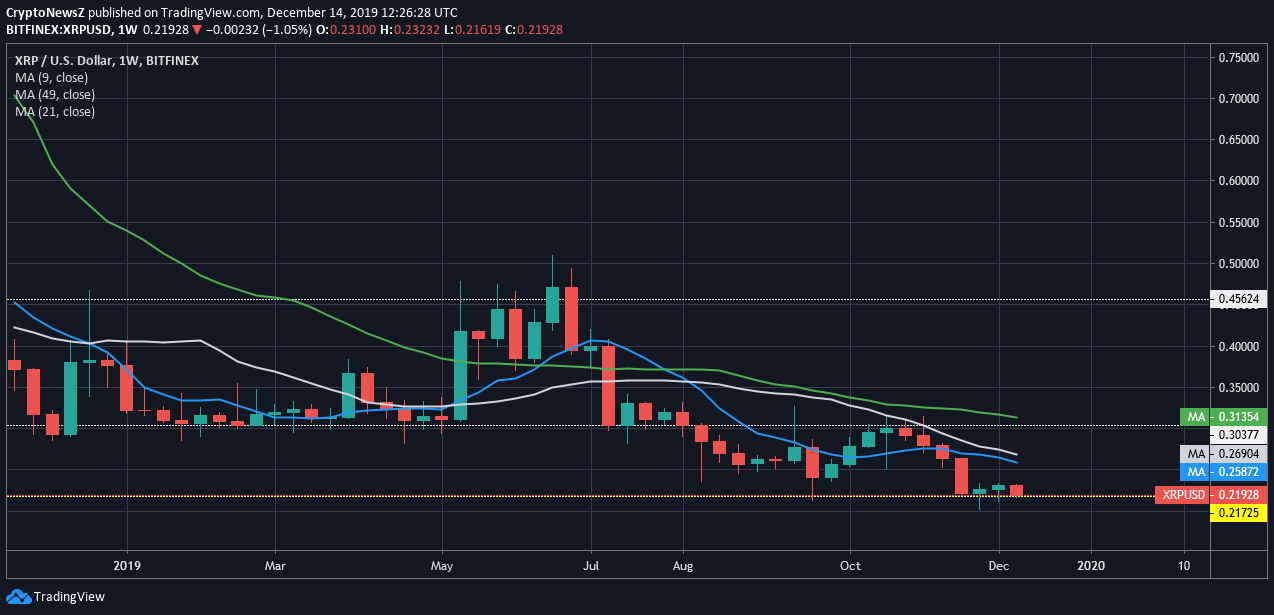
A quick glance through the weekly XRP chart, Ripple prices against the USD is hovering over the weekly Critical support at $0.217 denoted by the yellow dotted line. It is very important to hold this support, or else the XRP prices will find itself in the Alice in Wonderland-style down the rabbit hole.

Weekly XRP price is below 9 days, 21 days, and 49 days SMA (Simple Moving Average), denoted by the blue line, white line, and green line, respectively, in the below-given chart. Ripple value fell from the support at $0.303, and currently, this support turn into formidable resistance, and XRP tried to break this resistance around Oct 2019 but was unsuccessful. This resistance at $0.303 also coincides with the 49 days SMA, Bulls needs volume to push it above this and need to do a successful S/R (Support/Resistance) flip.
On the positive side, we may see a completely new trend from here for the Ripple and it is a good position to start adding XRP to Crypto’s Blue Chip portfolio.
Ripple Price Today:
Advertisement
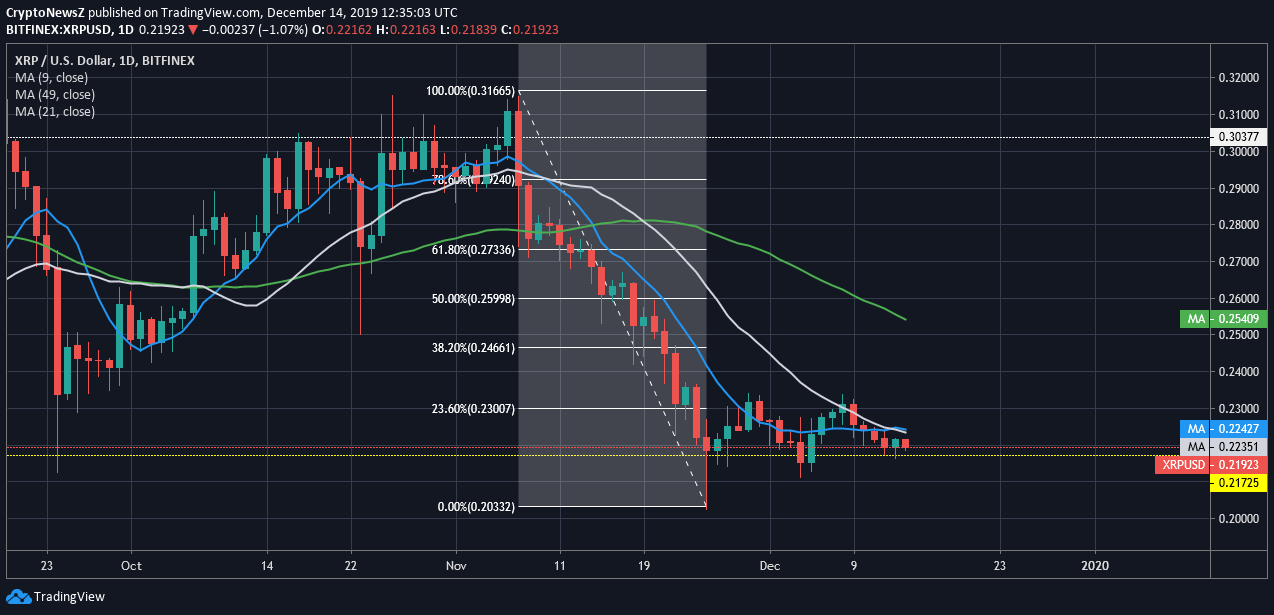
Ripple price, Today got rejected by the 23.6% Fib level and currently trading below 9 days, 21 days, and 49 days SMA, as shown in the below-given chart. Since prices are supported by the weekly critical support here, XRP price may bounce from here towards $0.25 to $0.30 mark as these are 49 days SMA (solid green line) and resistance line (white straight line).
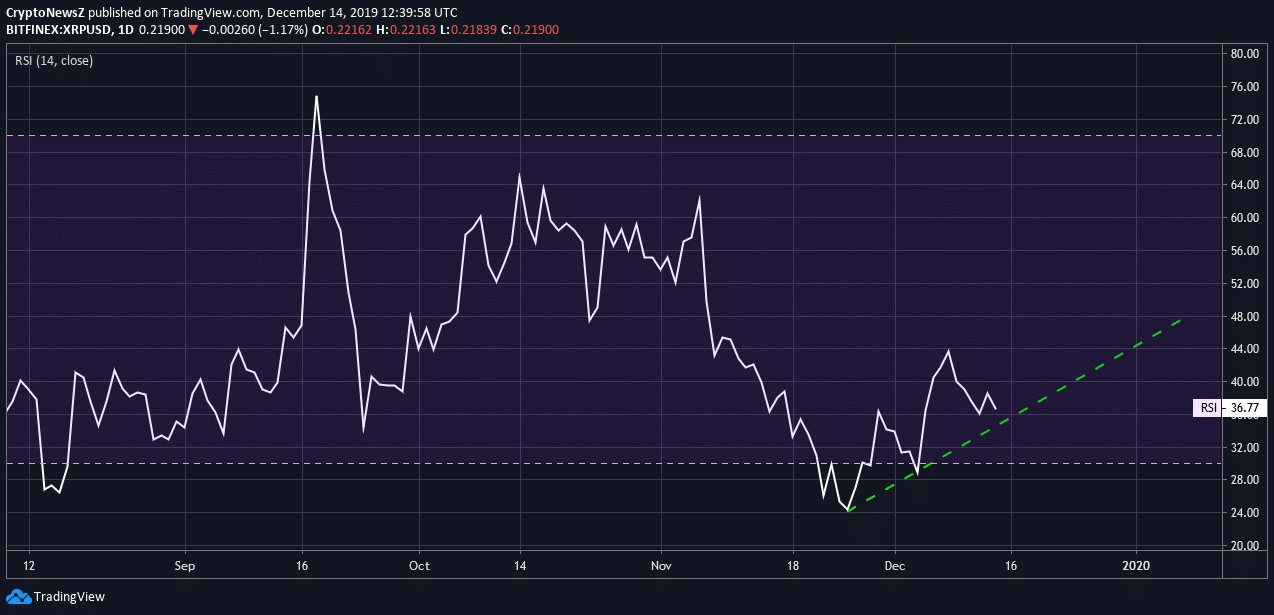
RSI is at 36.77 and making Higher Low’s along the trend line, as shown in the below-given chart. If history repeats again then the XRP prices may bounce from here.
Related: Check our Ripple Price Forecast
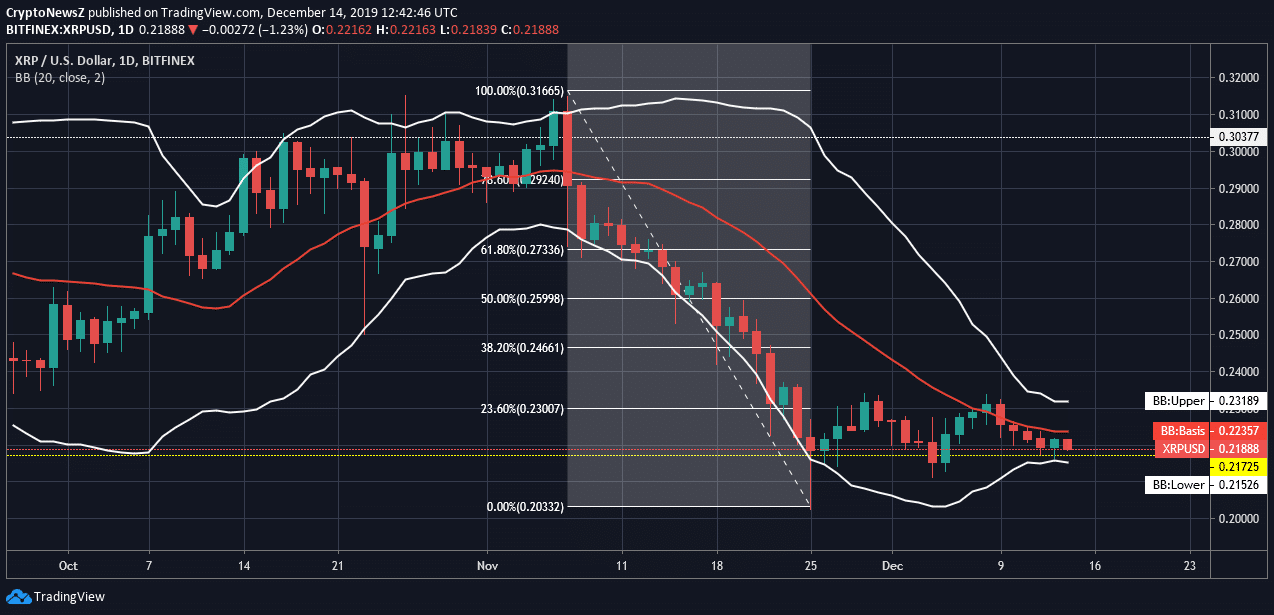
XRP price are below the mean average and near the lower Bollinger Band; these are narrowing down tightly and indicates that the very sharp price volatility is coming soon.
Advertisement
Conclusion:
- XRP prices are at weekly critical support, and RSI is making Higher Lows along the trend line.
- Bollinger Bands are narrowing down tightly, and current prices are at the lower Bollinger Band.
- With all these indications, XRP price may bounce from here as it did earlier twice and thus, making it a triple Bottom pattern.


