This content has been archived. It may no longer be relevant.
Stellar is one of the top ten Cryptocurrency by Market Cap and currently ranks No. 10. It is represented by the ticker XLM across the Cryptocurrency exchanges.
XLM Price Prediction
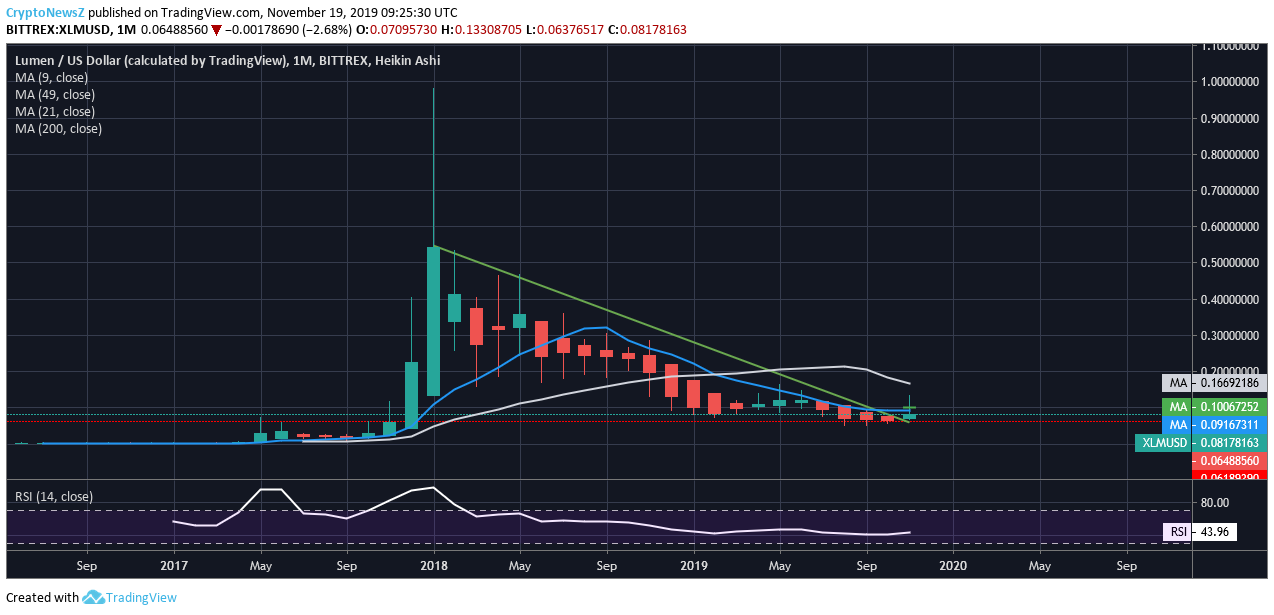
Stellar Prices are very close to the monthly support around $0.062, where current XLM prices are hovering around $0.0644 just above the monthly support. The downtrend has ended, and this month’s XLM candle marks new step towards the new cycle, and meanwhile, current prices are being rejected by 9 days SMA (Simple Moving Average: solid blue line).
Advertisement
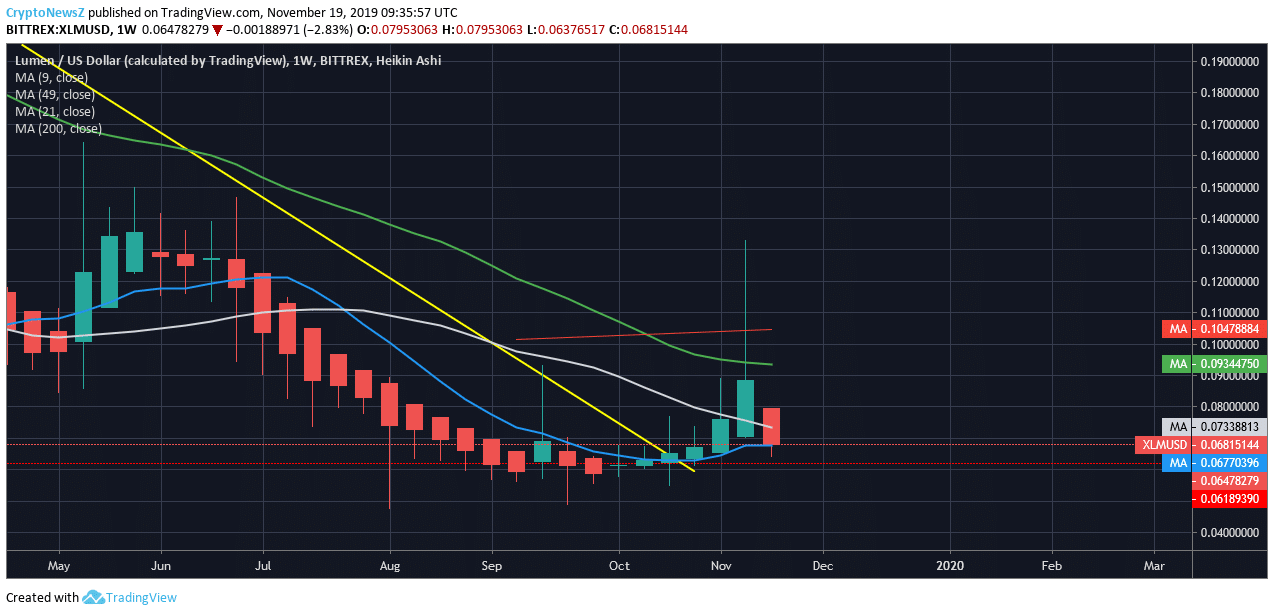
XLM weekly chart makes the picture pretty clear that the current XLM prices are supported by the monthly support (red dotted line) and 9 days SMA (Simple Moving Average: solid blue line). Previous weekly candles got rejected by 200 days SMA (solid red line) and 49-day SMA (solid green line).
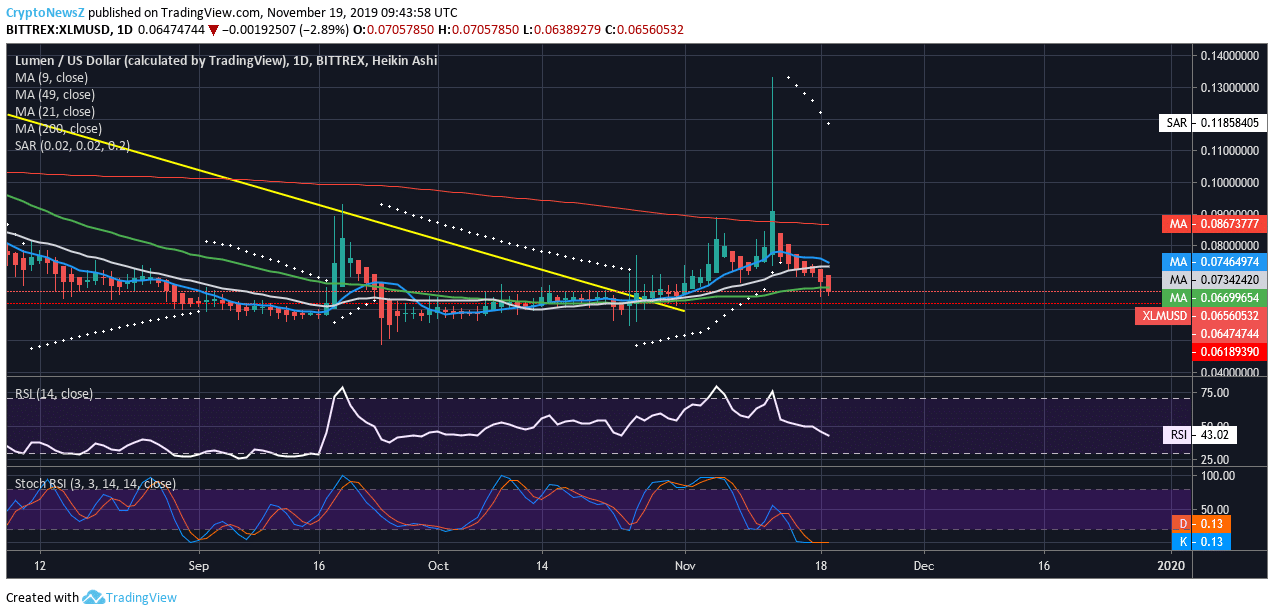
Looking at the 1Day Time Frame chart it is evident that the current price is supported by the monthly support and also with 49-day SMA (solid green line). RSI is moving towards oversold area whereas Stoch RSI (Stochastic Relative Strength Index) clearly shows the XLM price is oversold; thus we might see a relief bounce.
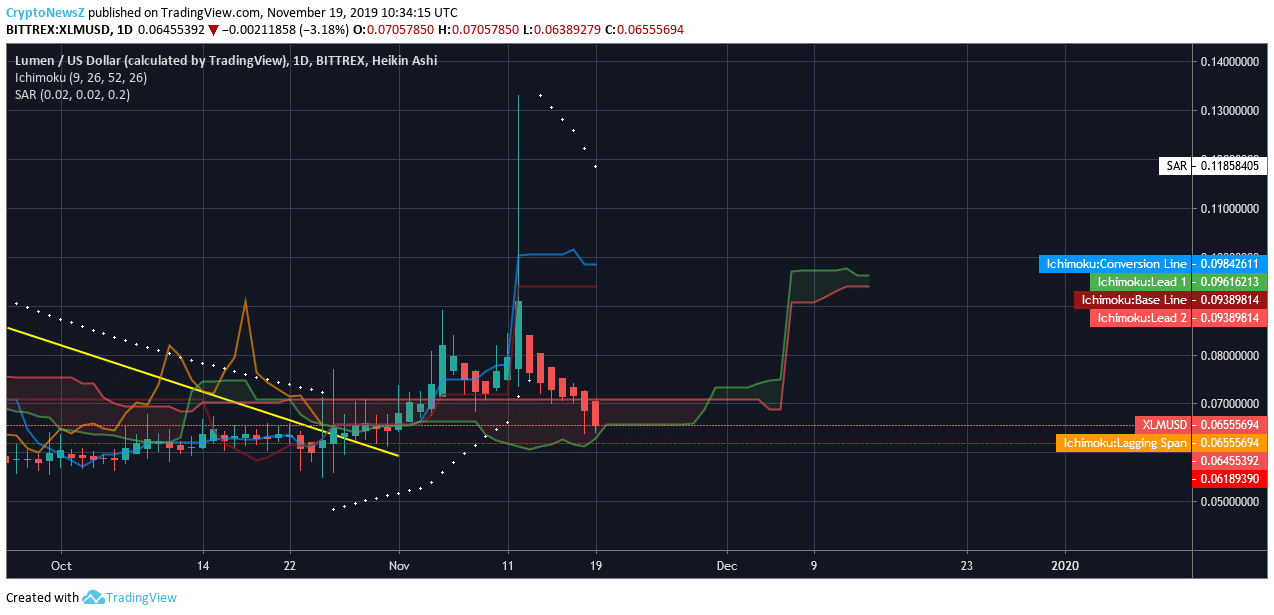
Ichimoku Kinko Hyo chart analysis of 1-day Time Frame: Prices are inside Kumo and currently holding to Senkou Span A, which is acting as critical support. Prices are below the Tenkan Sen (solid blue line), and Kijun Sen (solid red line) and Chikou Span (solid orange line) are inside the Kumo, all indicate a crucial moment for the XLM/USD. If prices go below the Critical support (Senkou Span A) then the prices can go lower to the monthly support of $0.0618 from the current price of $0.0655. It would be a wise decision to wait and watch the XLM price for the clear confirmations of Bull or Bear as of now.
4H Time Frame chart analysis of Stellar price forecast paints a clearer picture that the Stellar price has been falling below 200 days SMA (Simple Moving Average: solid red line) and moving towards monthly support at $0.062. RSI (Relative Strength Index) and Stoch RSI (Stochastic Relative Strength Index) clearly shows the XLM prices are oversold.

Advertisement
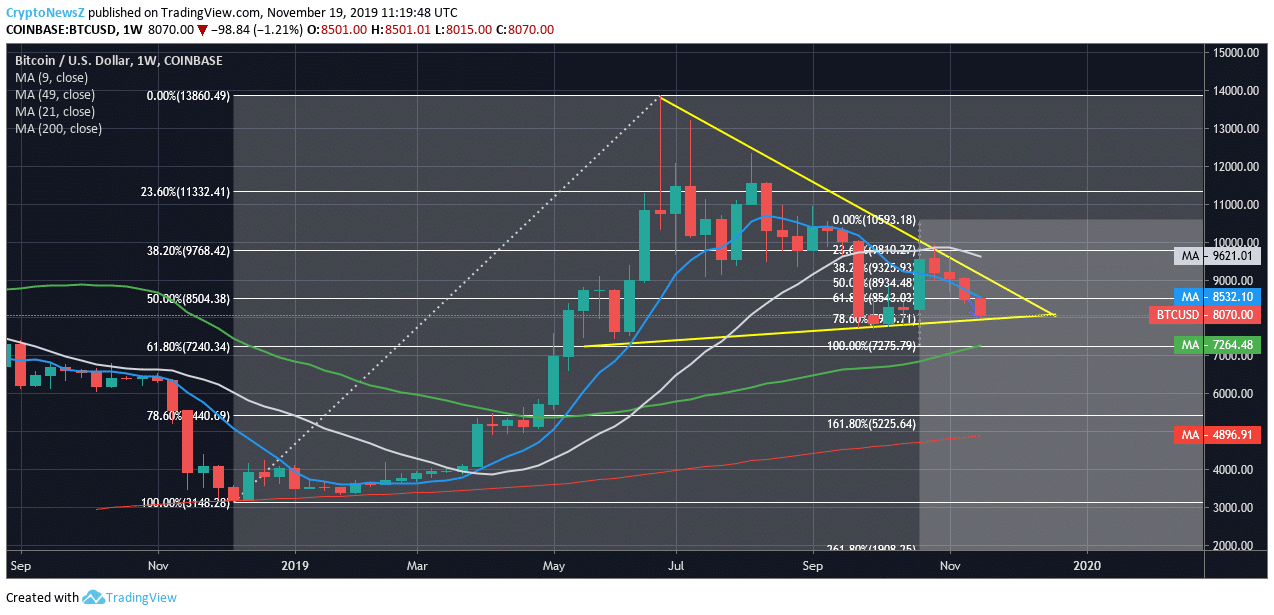
Conclusion: 4 Hour Time Frame chart clearly shows that the prices have been falling and moving towards the monthly support and price candles are below the 9-day SMA. Meanwhile, RSI and Stoch RSI clearly show the price in oversold region. Thus, we can expect a relief bounce from here. Although it would be a wise decision to wait and see where XLM price will head, as BTC/USD is just above 78.6% Fib level, i.e. $8000 area after its sharp price decline from 61.8% Fib level, i.e. $8500. Since BTC/USD is closing in the triangle, we might see a violent price action either in an up or down direction, which will sharply affect the Stellar price.
