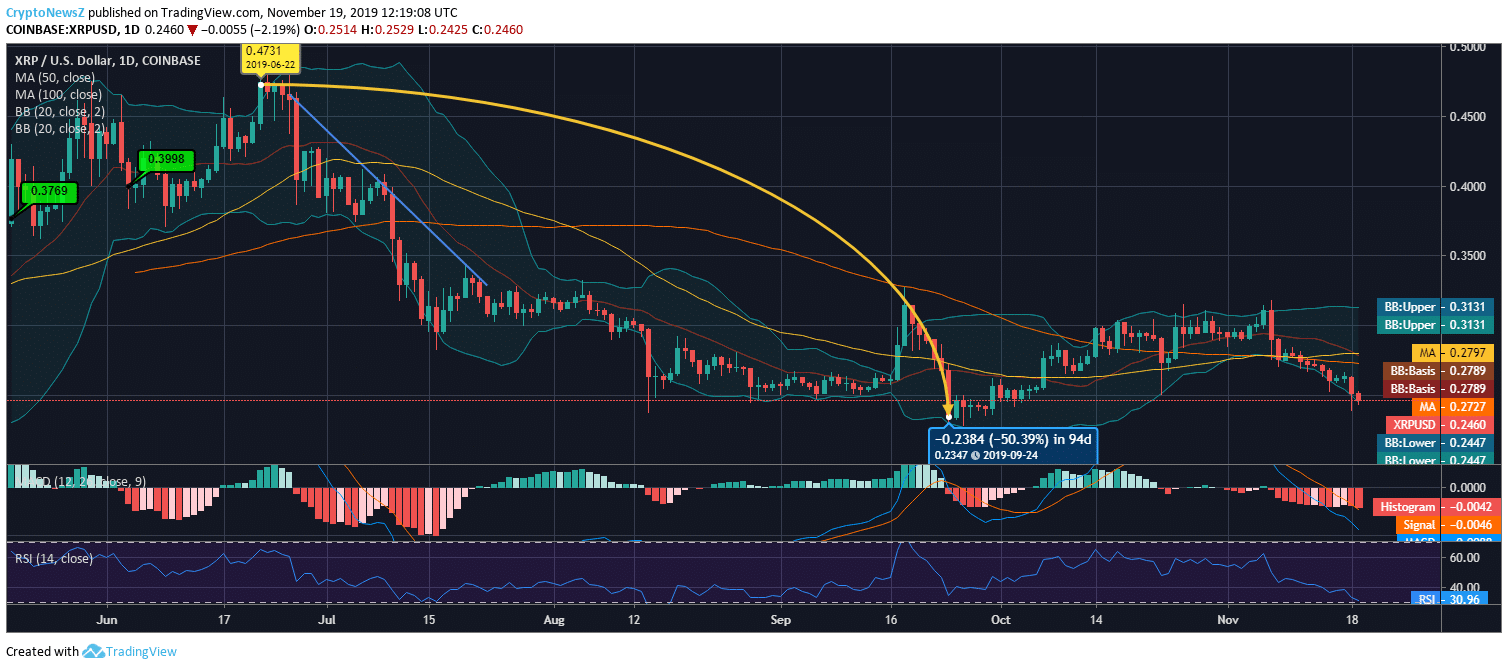
- The 6-month chart of Ripple looks extremely bearish; the coin needs a strong rebound
- Ripple has breached below many support levels lately; looks for a bottom
- The lowest price point in the 6-month time span is at $0.2347, and the coin is aggressively heading towards it
- XRP trades under a strong selling pressure
Advertisement
Ripple has tapped on to an extremely bearish price trend, which can be turned out into a negative vibe among investors soon, if the coin fails to recover its loss in valuation. The coin struggles to deal with the current sluggish market as it lacks momentum at the moment.
Ripple Price Analysis
In the month of May, XRP coin was trading with a substantial bullish impact as its price rose above $47 from $37. However, in July, the coin saw bears coming in as it strongly pulled back to $0.2955, breaching major support levels at $0.45, $0.40, $0.38, and even $0.30. After this hefty price fall, XRP price has surged above $31 only twice. The low swing below $0.27 breached temporarily when it traded above $0.31 in mid-September.
The pullback caused the coin to bottom at $0.23.47, which is its lowest price point over the last 6 months. After a mild upward correction, the coin is again heading downwards, and currently, Ripple to USD price is trading at $0.2448 at 12:19:08 UTC.

The Bollinger bands are heading towards a more volatile phase, which adds a bit of curiosity regarding the coin’s upcoming price moves. The MACD chart is heading downwards with its signal line on the upside, which shows Ripple’s current bearish nature. RSI is at 30, noting an oversold phase. Notably, XRP is carrying a selling pressure for a long time now.
Ripple is likely to see resistance at $0.2641, $0.2727, and $0.2798, while its support levels stand at $0.2484, $0.2413 and $0.2327. You can check the future price prediction of Ripple to get more information about the future prices of XRP.


