This content has been archived. It may no longer be relevant.
Bitcoin has been attempting to strike a hit above $10,400 since yesterday, but the coin has recently taken a nosedive and has traced a dip even below $10,200. It is to be seen how the rest of the crypto market responds to the recent price plunge of the most influential crypto-coin. However, BTC price is anticipated to recover its price loss soon, with a strong rebound.
Over the last 24-hours, the M.Cap of the overall crypto market has seen a decline from $269,288,209,408 to $264,758,368,125. For the last 1 month, all major crypto coins have been going through a sluggish era as Bitcoin has been range-bound between $9438.17 to $12,206.63. Meanwhile, major altcoins like Ripple and Ethereum have noted a remarkable downward price shift over a month.
BTC/USD:
Bitcoin price has been ranging from $9800 to $10,899 over the time span of the last 15 days. However, the first half of this month was pretty bullish for BTC as it managed to climb above $12,000 and traced a high spike. Since then, the coin has been giving negative signs as it could not clear resistance above $12,200. The BTC price corrected down from there and traced a lower high at $11422.04. Later, Bitcoin saw bottom at $9534.20 with a price decline of 21.87%.
Seeing a support level here, BTC has corrected up from there and reached $10899.00 and formed another lower high. Here, the price of Bitcoin has traced a bearish trendline. At 04:11:37 UTC, Bitcoin price today is trading at $10,168.00.
The short term SMA line (9-days) has just climbed above its long term SMA line (100-days) which indicates a bullish price move. RSI of BTC is near 50 showing no extremities. MACD for the coin is heading for a bearish crossover. You can get more details about Bitcoin future prediction & BCH Future on CryptoNewsZ’s forecast page.
XRP/USD:
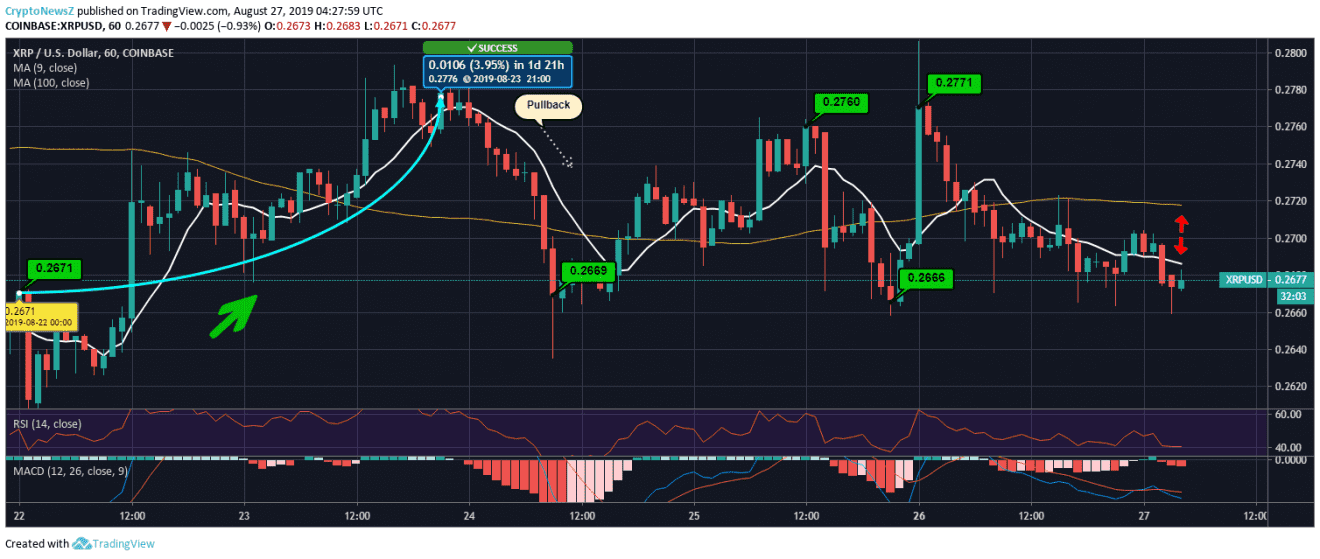
Ripple price may come back to square one if it continues to trade bearishly as it has broken below $0.27 recently. XRP had its opening price as low as $0.26 on 22nd August, though it managed to note an increase over the day as it closed at $0.2709. Later, XRP gradually soared and reached as high as $0.2776 with an increase of 3.95%. Then the coin slipped with a pullback to $0.2669 and bounced up above $0.27 again.
After a plunge near $0.2666, Ripple saw a sharp surge to $0.2771 yesterday morning and since then the major altcoin is constantly dropping. At 04:27:59 UTC, Ripple price today is trading at $0.2677.
RSI of XRP/USD is near 40 showing a stable momentum, while MACD is in the bearish zone. Plus, its long term SMA line is above its short term SMA line, which also indicates to its current bearish nature.
ETH/USD:
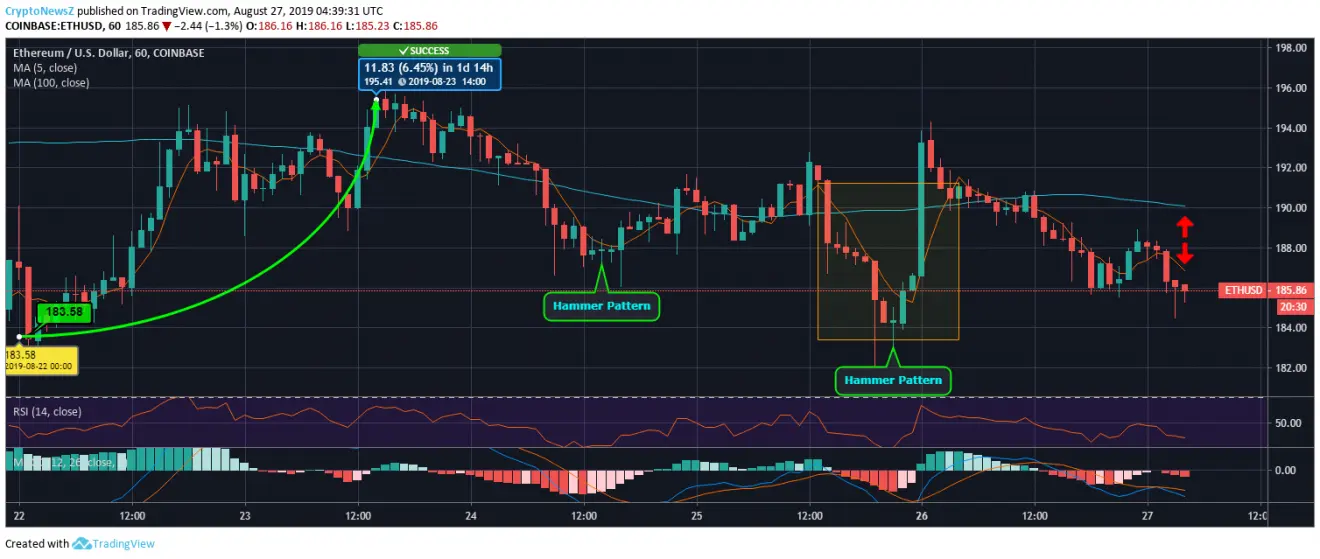
Ethereum price is correcting down since yesterday morning when it saw a sharp price hike to $193.44. ETH was as low as $183.58 5 days ago, and it steadily surged to $195.41 with an increase of 6.45%. After a pullback, ETH price path has formed a hammer pattern which points out to a bullish trend reversal movement. Price of Ethereum mildly rebounded above $192 and again dropped heavily below $184 tracing a dip. After a sharp surge followed by a downward correction, Ethereum price today is trading at $185.86 at 04:39:31 UTC.
ETH Price is currently under bearish pressure, as its long term SMA line is above its Short term SMA line. RSI for ETH/USD is heading towards oversold phase, and MACD is also moving in the bearish zone.
LTC/USD:
Advertisement
Litecoin price has traced a zig-zag pattern over the last 5 days as it manifests two major price moves, one is a plunge and another is a rise, both of more than 5%. LTC started to trade above $71.25 on 22nd August and jumped above $75.45 within a couple of days. Here, it struck a price increase of 5.89%.
After maintaining its price range above $72, it sharply bottomed at $71.12 and it bounced up from there. Currently, the coin is correcting down from $75 while tracing a bearish trendline.
At 04:49:30 UTC, price of Litecoin is trading at $72.82. Like other crypto-coins, LTC’s SMA lines are giving bearish signs. RSI for LTC/USD appears stable while MACD is bearish.
BNB/USD:
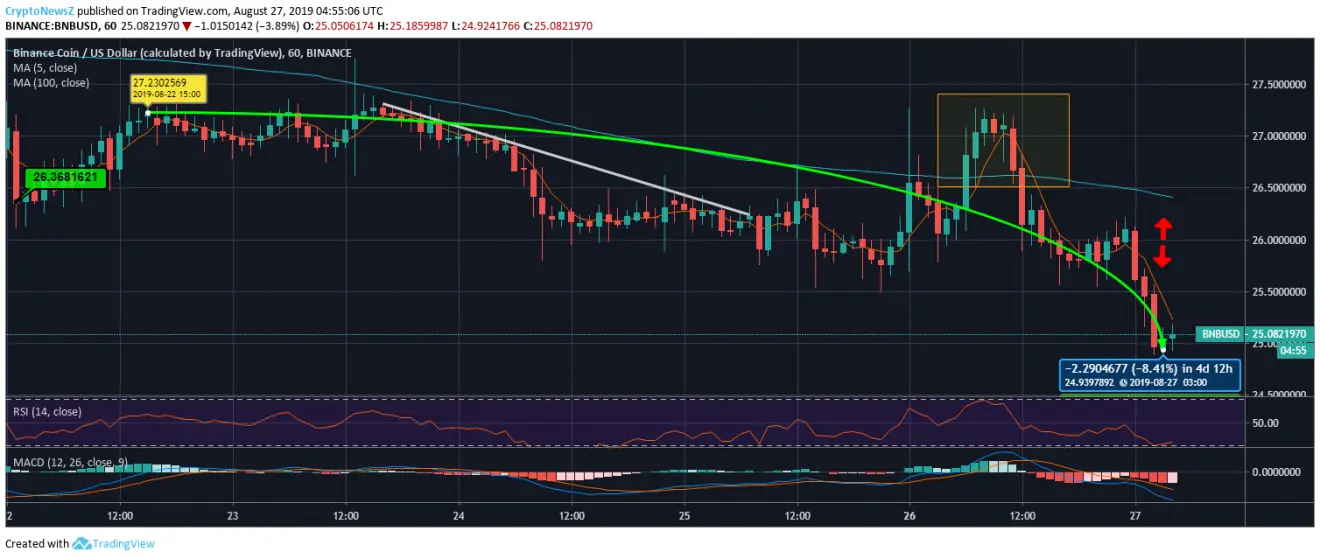
Binance coin has emerged as quite an impressive cryptocurrency as far as investments are concerned as BNB coin has maintained an optimistic price path. However, in the last 5 days, BNB has also witnessed a price fall of more than 8%. The coin initially traded to $27.23 from $26.36 and remained there for a couple of days. BNB slowly started to shed its value and traced a bearish trendline. Breaching the bearish trendline, BNB had an up-spike above $27 and currently, the coin is correcting down at $25.08 at 04:55:06 UTC.
RSI is near 30 indicating an oversold momentum, resonating with MACD’s bearish zone. Binance Coin’s long term SMA is above its Short term SMA, pointing out to its bearish trend.
BSV/USD:
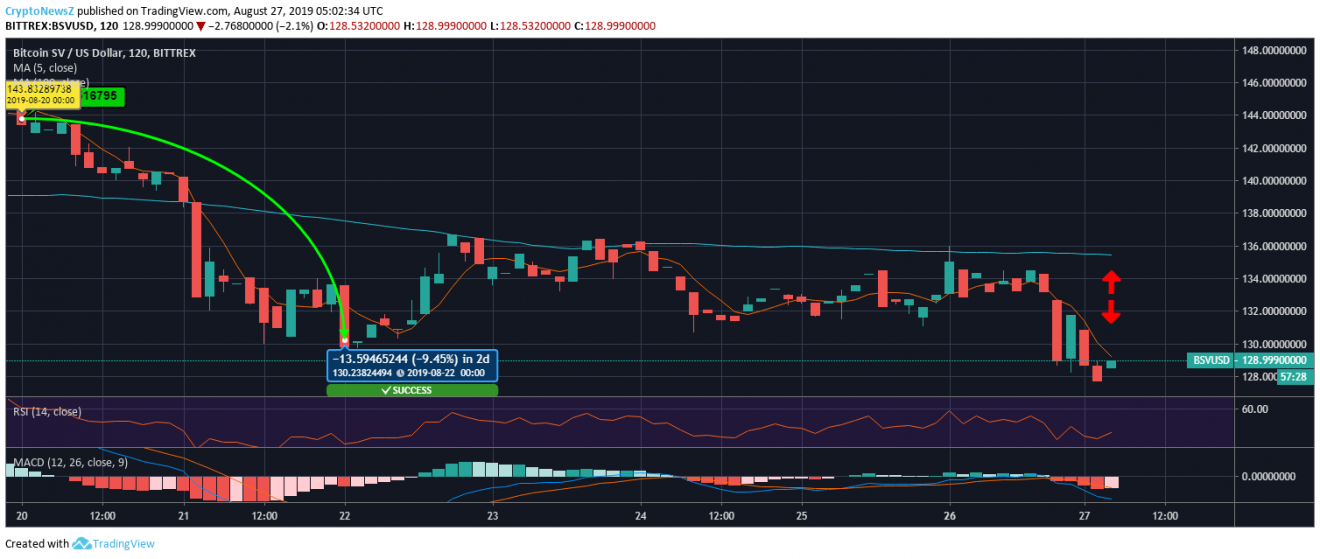
Bitcoin SV’s weekly price chart shows how the coin saw a decline from $143.83 to $130.23 with a price decrease of 9.45% initially. The coin has started a mild recovery but has not been able to trade above $137. BSV is currently below its key support level of $130 and may extend its bearish trend as it is hovering around its next support level of $128. At 05:02:34 UTC, BSV is trading at $128.99.
The technical picture for the coin is quite bearish as its long term SMA line is well above its short term SMA line. RSI appears stable but MACD is in the bearish zone.
XLM/USD:
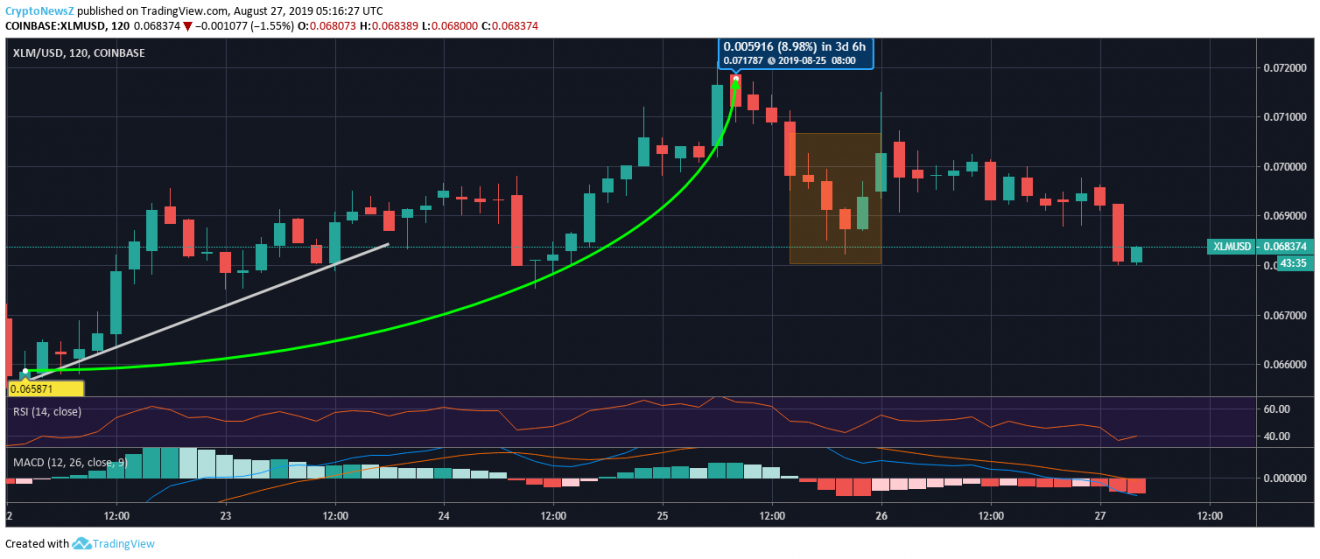
Stellar Lumens’ 5-day price chart looks comparatively hopeful as the coin is trading with a higher price as compared to where it was 5 days ago. Tracing a bullish trendline, XLM price uplifted from $0.06 and reached above $0.068 before closing. Maintaining a bullish impact, the Stellar price reached as high as $0.071 and corrected down tracing a dip near $0.068. After a mild rebound, XLM price has again dropped to $0.068 at 05:16:27 UTC.
RSI for the coin is near 40 showing no extremities, but MACD is moving in the bearish zone with its MACD line below the signal line.
XMR/USD:
Monero’s monthly chart shows how XMR bulls have lost control over its price trend in the latter part. XMR, which was trading at $82.60 on 28th July saw the price fall at $77.60 and then it took a massive price surge to $97.31 with an increase of 25.40%. Then XMR saw a steep fall near $75.77 and found decent support there. From here, it escalated above $89 with an increase of 17.63%, tracing a lower high. The Monero price formed another lower high at $82 and currently, the coin has corrected down near $78.28.
Monero’s SMA lines also indicate a bearish price trend. RSI is heading towards oversold momentum and MACD is moving in the bearish phase.
ETC/USD:
The 5-day Ethereum Classic price chart shows a bit positive signs as it has sustained its price scenario above $7 after the notable initial surge given in the chart. The 26.27% price hike has caused the major altcoin to climb above $7 from $6.01. After that, ETC price has traced a mild bearish trendline and has formed a dip below $7. But, in the last couple of days, Ethereum Classic has corrected up above $7 and is currently at $7.21 at 05:32:36 UTC.
Advertisement
RSI for ETC/USD is near 50 showing no extremities, while MACD is about to enter into the bearish zone. Although, its short term SMA line is above its long term SMA showing its current bullish nature.
NEO/USD:
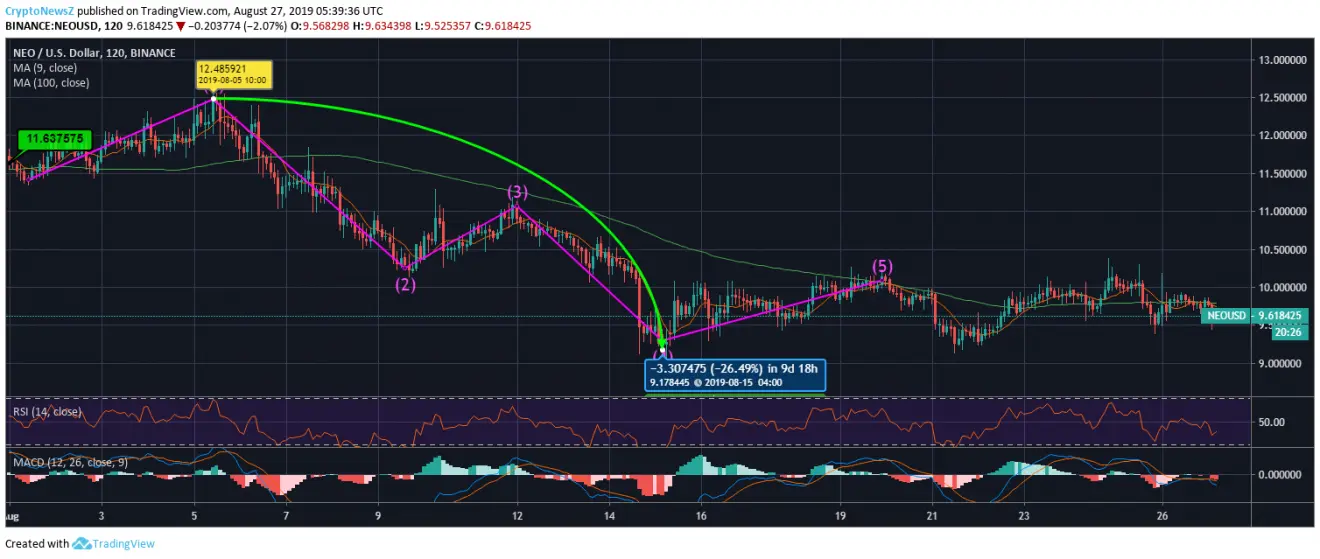
NEO price chart exhibits a downward price shift with a bearish bias since the start of this month. The NEO coin had traced a high spike above $12 and from there it has gradually tumbled to $9.17 with a notable price decline of 26.49%. After the price fall, the coin kept hovering around $9 and, at present, the coin is at $9.61 at 05:39:36 UTC.
RSI of NEO coin is near 50, showing a stable phase, while MACD remains in the bearish zone. On the other hand, the Short term SMA line has just moved below the long term SMA line.


