MATIC is currently ranked at 17th position among the leading cryptocurrencies with a market capitalization of close to $7 billion. The recent bull run in the last week that gave investors a 38% ROI has fueled newfound value to the polygon network. What started as a network for creating and supporting Ethereum-compatible blockchain networks has become the new face of tokenization.
Polygon is known for its scalability solutions that have helped create a multiple-chain Ethereum ecosystem, making it easier for new transaction systems to piggyback on Ethereum secure networks.
MATIC Price Analysis
Polygon (MATIC) was in a clear downtrend for the majority of the last two months after the drastic profit booking scenario that cropped up during May 2021. It has taken support from its 200 Day moving average, which has acted as a long term support zone.
Since MATIC has never traded even close to its 200 DMA in the last six months, there was a strong possibility of a retracement/ profit booking. There are some key resistance levels that can stall the current bullish sentiment, but even so the buying action is quite inevitable given the rise in volumes.
Immediate Resistance: $1.24
Advertisement
Strong Resistance: $1.70
Immediate Support: $0.66
200 Day Moving Average: $0.68
100 Day Moving Average: $1.13
Some key price action such as the rise of the 200 DMA line and fall of 100 DMA lines verifies the fact that MATIC is positive in long trend and negative in the last few months. The movement of the 100 DMA line, towards the upward direction, will indicate positive sentiment, but before that, we are at the mercy of the buyer’s consistent momentum. Currently, MATIC has breached multiple short resistance with a huge one day rise that started with a single day rise of 29% on 21st July 2021.
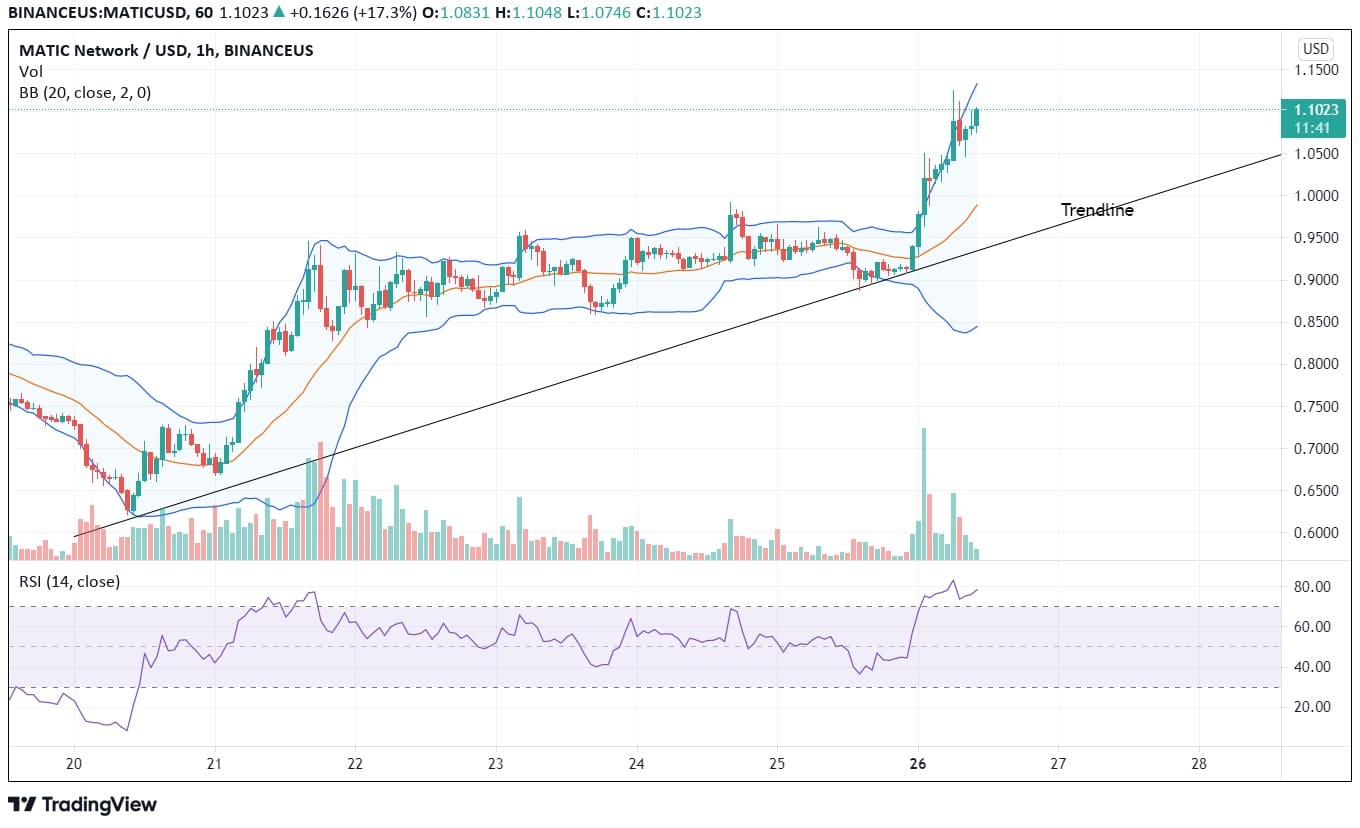
As per MATIC coin price prediction, the coin will be facing some resistance at 100 DMA before it becomes bullish on both short and long term charts. The rise of RSI towards 58 from oversold zones is affirming the positive up move, we are witnessing now. The last time MATIC’s RSI reached overbought zones it was trading above $2.00. The current rally seems sustainable as it is respecting the trend lines and important levels.
Advertisement
On hourly charts, MATIC is showing some strong bullish movement but it has to be followed with some consolidation which will align with the 100 DMA resistance. Consolidation at current levels for a day or two is necessary for MATIC to break through this resistance in an attempt to reach $2.00 valuations. In merely a week MATIC has delivered a substantial 63% return, which is phenomenal and indicative of its potential to break it’s all time high.
Bollinger Bands widening gap and MATIC trading at its higher moving average lines is also supporting the current buying action. The fall should be limited with the orange lines indicating the mean average line. RSI at hourly charts is at overbought zones, hence there will be a short profit booking in the coming hours before MATIC moves higher.


