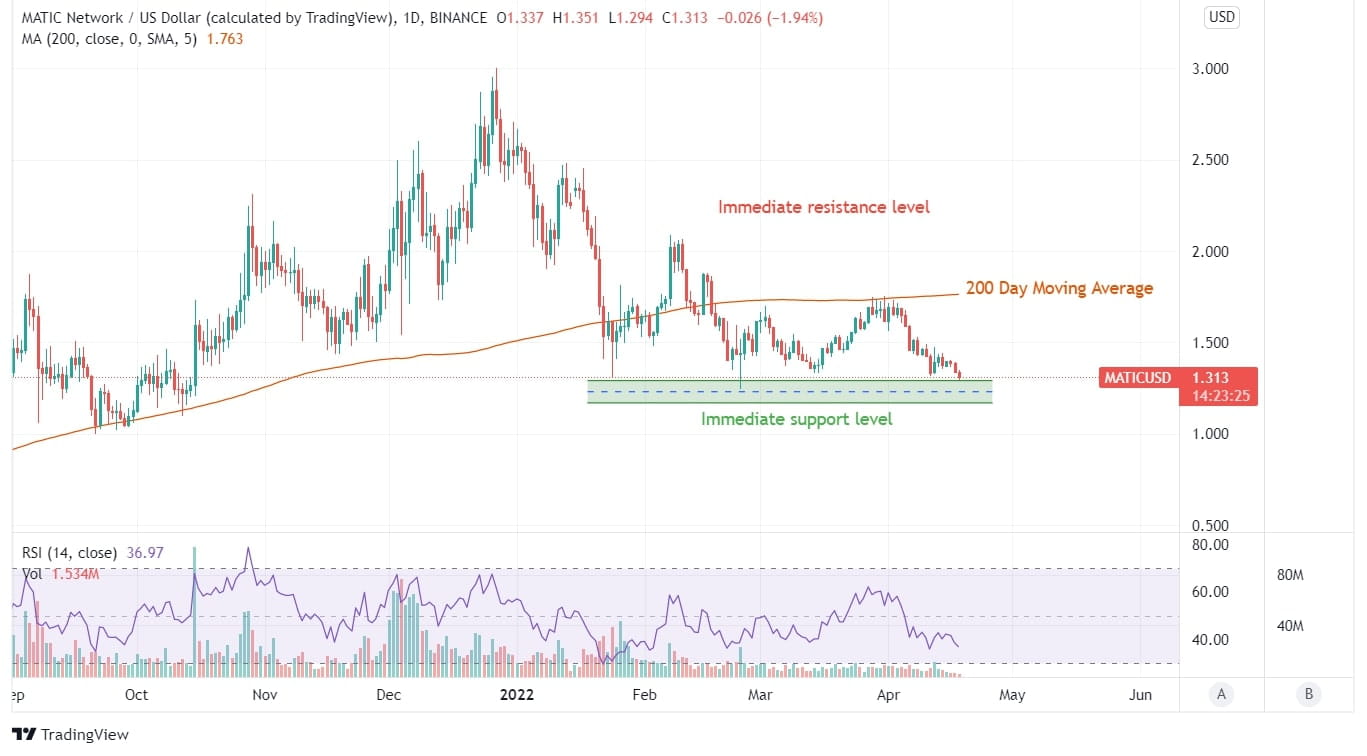
Since the beginning of 2022, the price trend of MATIC has been negatively consolidating. The lower level of $1.3 has become the best buying zone for MATIC holders. The buying sentiment emerging from these levels is getting severe flak from the 200 DMA curve and losing the sentiment quite sooner. This loss of continued buying sentiment is hampering a consistent growth in value over time.
$1, $2, and $3 have become the most substantial psychological levels for the MATIC token in recent months, and of these levels, $1 remains the strongest. The consistent profit booking at the 200 DMA curve has been a major level to signify further price action in the coming days.
From an investment point of view, some technical data of Polygon can be derived from current price action charts. MATIC needs to surpass the $2 level to become trending and a worthy cryptocurrency for interested buyers.
Advertisement
The daily charts and weekly charts offer a different perspective on the possible outcomes of MATIC price trends. At this rate, MATIC is headed towards another face-to-face with its crucial support level third time in 2022 without any sign of breakout in the coming days. Check out Polygon coin price prediction to know if it will be able to break the psychological barriers.
While Polygon (MATIC) attempted to overcome the 200 DMA resistance level, as seen through the consolidation that happened at $1.6 and $1.75 levels during the last week of March 2022, people are searching for a firm price because of the aggressive volatility to invest in the MATIC progress.
At this rate, MATIC is coming closer and closer to its immediate support level. In terms of price trends indicated by technical indicators, RSI showcases the potential for MATIC to consolidate and breach previous levels. Last time RSI tanked from 62 levels and continued to fall to 36.
Since taking support from this level, MATIC spiked to $3 levels in November 2021, which shows a very positive trend line. This trending curve quickly turned sideways and dipped to $1.3 levels in less than four months. The current tussle between critical levels and resistances is at a pivotal turning point.
Advertisement
Failure to hold on to the current supporting level can push potential buyers out of the sentiment and retest the support of MATIC at $0.80.


