OmiseGo recently tweeted about their P2P payment network which will help the traders to integrate, scale and build their project on a secure payment network platform. Only time will tell if the platform is actually beneficial for the users or not.
Want to build, integrate, and scale your project on a secure, fast, and affordable peer-to-peer payment network? We’re here for you: https://t.co/byunCDXTme #fintech pic.twitter.com/Hpk7pT7qHy
— Boba Network 🧋 (@bobanetwork) September 18, 2019
OmiseGo Price Analysis:

After having tracked the price movement from the past 5 days, we see that OMG was initially seen trading below the baseline. The lowest touchdown was seen on September 16, at 12:00 UTC, when the price was $1.04. The price of OmiseGo then escalated by 15.68% on September 18 at 14:20 UTC marking the highest of the said time frame at $1.20.
Yesterday, the value saw a drop of 9.59% at 04:25 UTC, which led the coin to the trading value of $1.09. Later, with moderate volatility on board, the price slightly increased by 5.80% at 20:00 UTC when the trade value changed to $1.15. The current value is a result of a marginal 1.89% fall from the latter price mark.
Short-Term Prognosis:
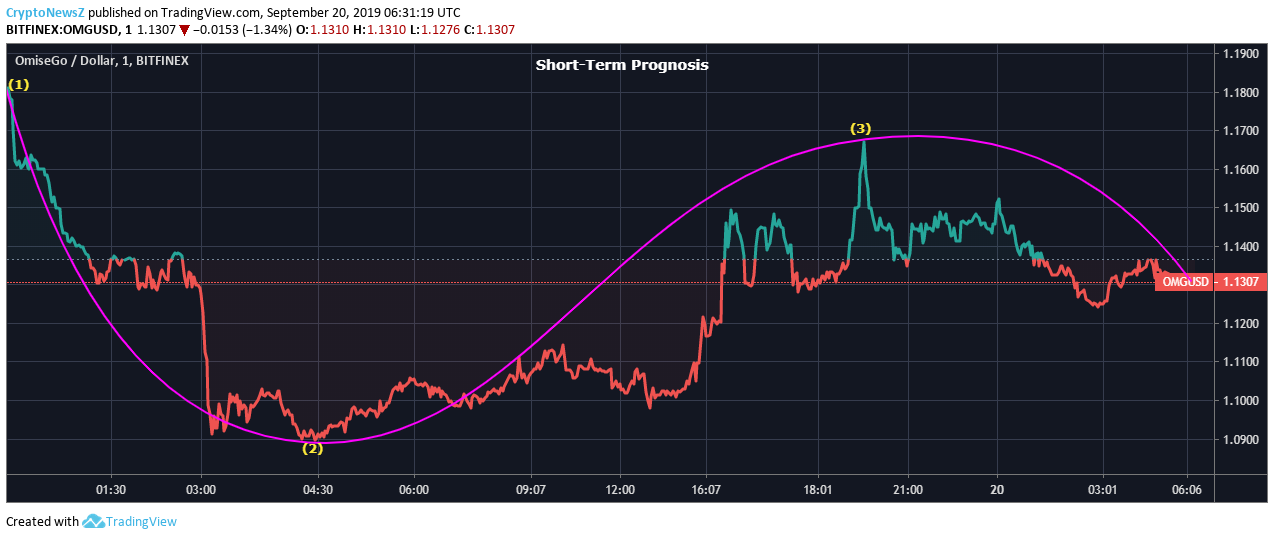
Speaking of the short-term movement, traders can make some profits if they buy/sell the currency on the lowest/highest touchpoint as shown in the chart. As of now, it seems that one might want to wait for some more time for the price to reach the lowest point in order to invest in the coin.
Long-Term Prognosis:

Advertisement
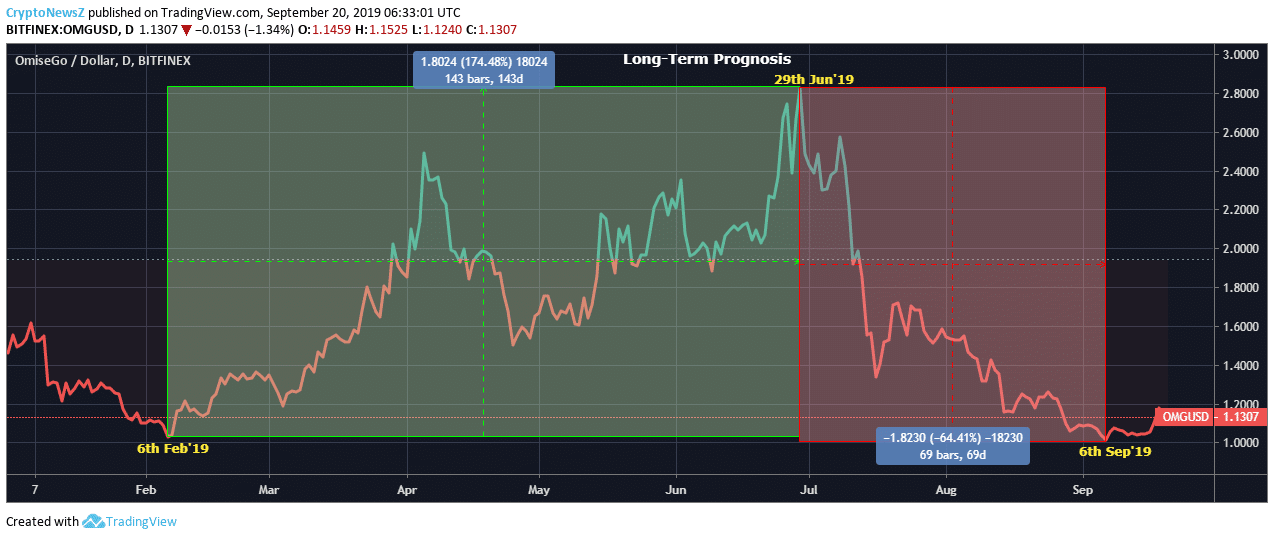
The long-term movement of OMG is quite similar to other altcoins. The value as of now is seen below the baseline. Hence to read more about OMG predictions, you must visit our forecast page to know the coin’s upcoming years’ price updates!
Traders can conclude to an ideal trade decision depending on their interest in long-term or short-term investment. The resistance and support levels are calculated as follows:
Resistance Levels:
R1: $1.19, R2: $1.23, R3: $1.28
Support Levels:
Advertisement
S1: $1.1, S2: $1.05, S3: $1.01


