The crypto market has begun the month with a slight volatile movement as the major coins were affected at first but soon an upward movement was experienced in the market. Amidst the fluctuations, the upsurge was quite a surprise and many traders took it as an indication of the price rally.
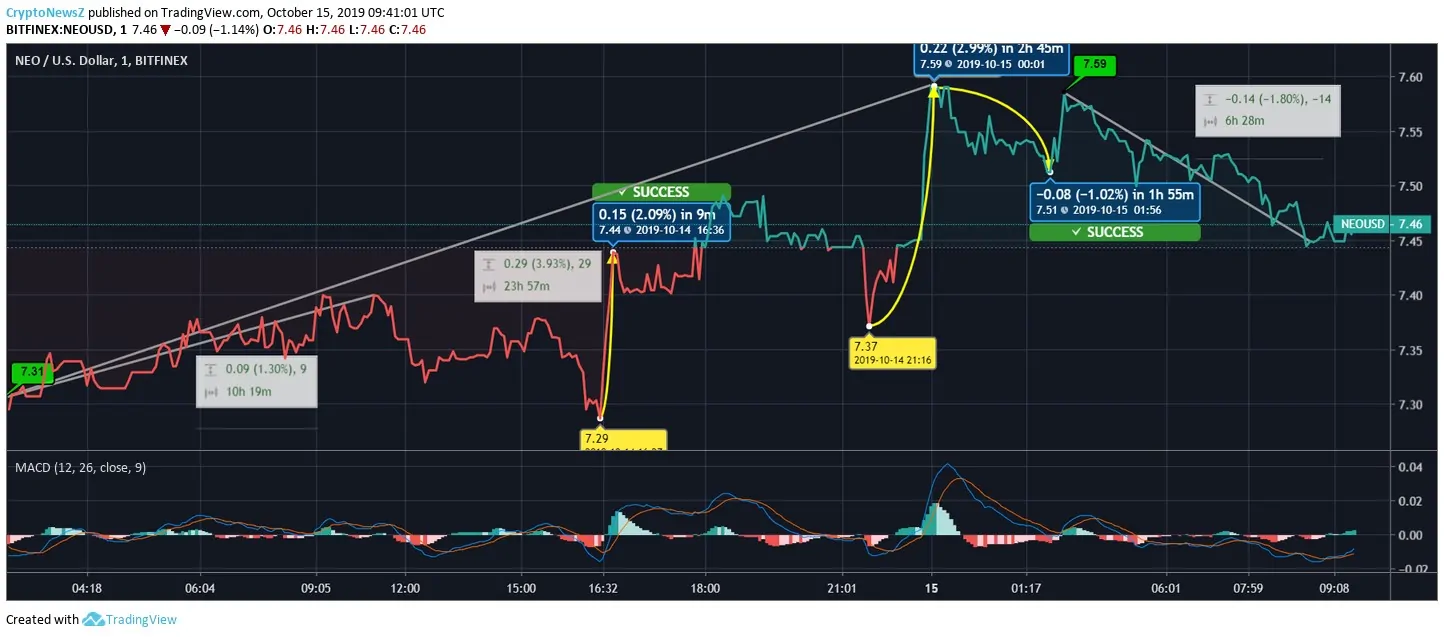
NEO price trend is seen moving with a moderate pace. The last fall and recent volatility have affected the coin at large. The price is diminishing, and we are anticipating that the intraday movement might bring marginal losses to the traders. To understand the movement more precisely, let’s have a look at the price chart.
NEO to USD Price Analysis:

Yesterday, the price started soaring from the beginning of the day dated October 14 and the counters changed from $7.31 to $7.35 by 1.30%. There was a slight drop in the price, but it soon picked up again and went to $7.44 by 2.09%. The price kept hovering at the same level for some time. Before closing, the price touched $7.60 from $7.37 by 2.99% and the day closed with an upsurge of 3.93%.
Advertisement
Today, NEO started with a fall and the counters shifted from $7.59 to $7.51 marking a regression of 1.02%. However, there was a slight recovery, which could not be sustained and as a result the price shifted from $7.59 to $7.46 having a regression of 1.80%.
If we look at MACD histogram, then the signal line seems to cross the MACD line and moving up but remains below zero.
With the market cap of $527,978,633, NEO is currently trading at $7.48 holding the immediate resistance level at $7.54. Here’s the support and resistance level chart for NEO. On the basis of our experts’ NEO price prediction 2025, the traders are recommended to opt for long-term investment as the same would fetch them a colossal profit.
| Resistance Level | Price | Support Level | Price |
| R1 | $7.54 | S1 | $7.37 |
| R2 | $7.6 | S2 | $7.26 |
| R3 | $7.71 | S3 | $7.2 |
Advertisement


